

Graphing School Tools Worksheet
This graphing school tools worksheet has 1st graders count 18 backpacks, markers and rulers, color a bar graph from their own count, and answer three questions about it. Answer key included for fast, no-prep data practice.
$6.97
Or free with a membership — members pay $3.33/mo for all 10,000+ resources. See plans
Want this one free?
Tell us where to send it and it’s yours — no card, no catch.
One free resource per teacher. We’ll also send free teaching ideas each week — unsubscribe anytime.
Teaching is easier with a membership
Unlimited printables, games & videos for PreK–6th — for your classroom or homeschool. Cancel anytime.
Start your 3-day free trial$0 today · cancel anytime · Instant access to 10,000+ resources
About this resource
Description
Making a picture graph is a first grader’s very first taste of data work, and this graphing school tools worksheet keeps every step of it in plain sight. Before a child can read a graph, they have to build one, and building one starts with a careful count. Here the data is a scattered box of backpacks, markers and rulers — three categories, just as first grade asks for — and the child has to sort that jumble by eye, keep a running total for each kind of school tool, and then turn those three totals into three bars that anyone can read at a glance. That is the whole idea behind organizing and representing data, and it is a skill that carries a student straight through elementary math.
This 1st grade back to school worksheet works in three short, numbered steps. First the child counts each picture in the box. Then they color one square in the bar graph for every picture they counted, which turns the count into a shape they can compare. Finally they use their own finished graph to answer three questions: how many rulers there are, which tool showed up the most, and how many more markers than backpacks are in the box. Because the child builds the graph before they read it, the answers come out of their own work rather than out of a chart someone else made. It is a perfect first week of school activity, and it doubles as a quick assessment of counting to twenty.
What’s Included
- 1 print-ready PDF worksheet
- Answer key
- 18 school-tool pictures to count and sort into 3 categories
- 1 single-unit bar graph to color, with a scale of 1 to 8
- 3 read-the-graph questions, including a how-many-more comparison
Three things make this graphing school tools worksheet stick with young learners. It keeps the data set small and concrete, so a six-year-old can hold all three categories in their head while they count. It asks the child to build the graph themselves, which means the bars are not an abstract picture but a record of something they did. And it ends with a comparison question, so the graph becomes a tool for answering something rather than an art project — exactly the habit first grade data standards are reaching for.
Teachers and parents can stretch this activity in a few easy directions. Empty a real pencil box onto the table and graph what is inside, then compare the class results. Turn it into a survey by asking classmates which school tool they use the most and graphing the votes. Ask the child to write their own question about the finished graph and quiz a friend with it. And for extra counting practice, sing along with the counting song below before the pencils ever come out.
Related Resources
What teachers say
Reviews
You must be logged in to post a review.
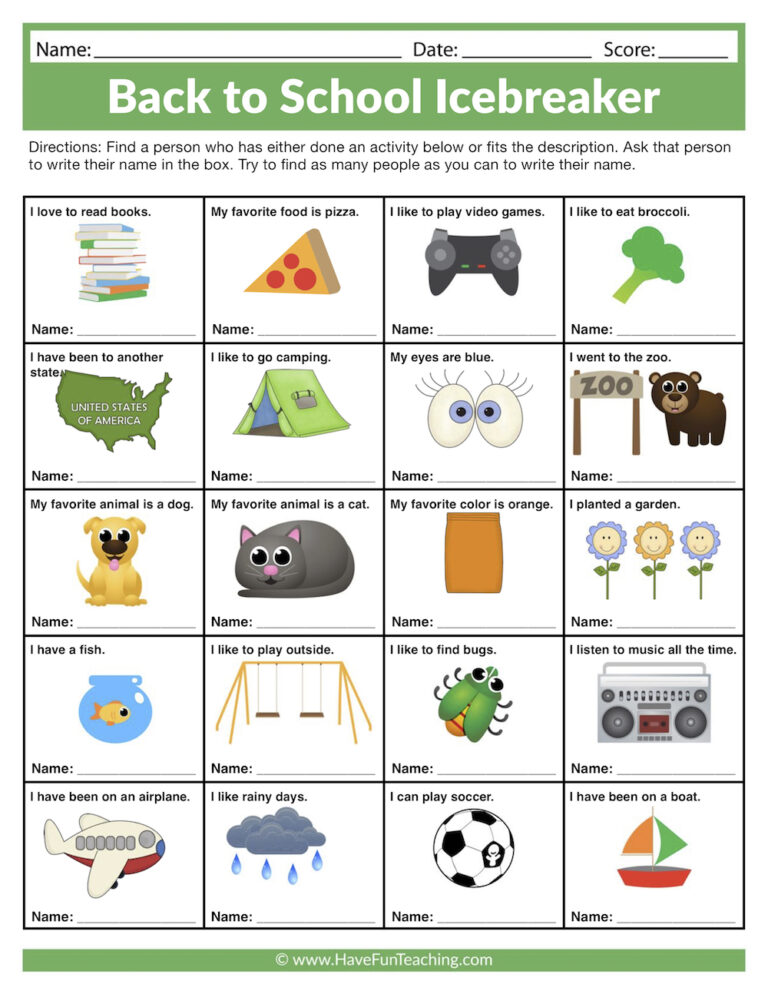
A back to school icebreaker worksheet for first grade, where students find classmates who match twelve fun picture statements and collect their names. A no-prep, get-moving activity that builds friendships during the very first days of school.

A back-to-school All About Me worksheet where 1st graders draw a self-portrait and finish five friendly sentence starters about their favorite things. A no-prep, first-day icebreaker that helps students share who they are.
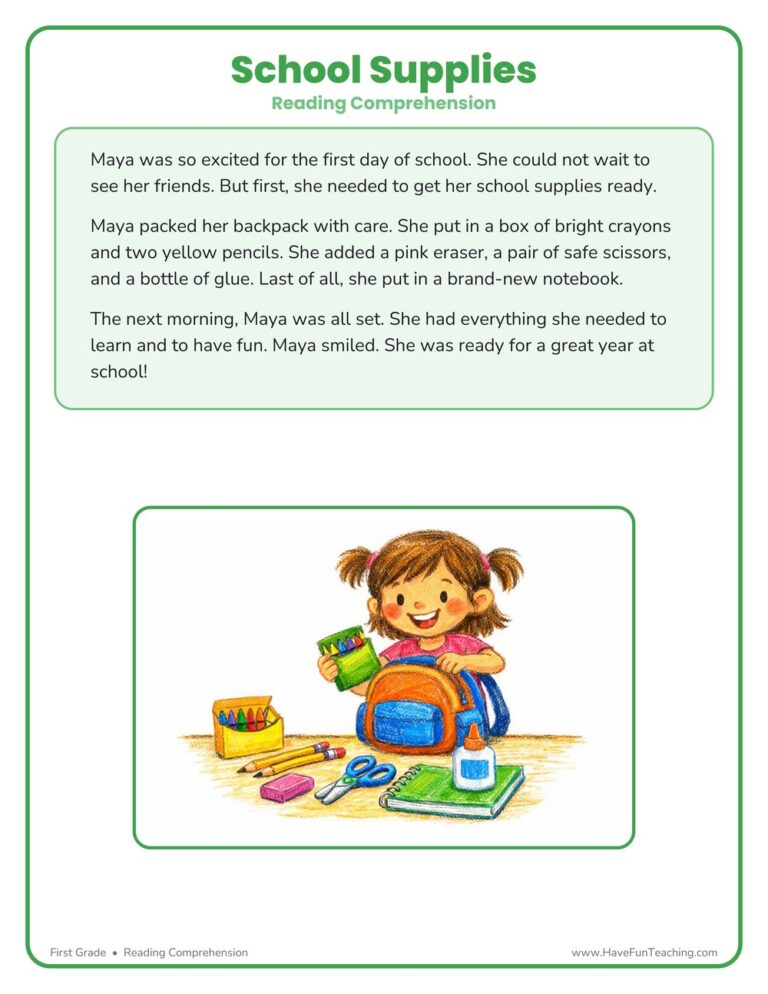
Students read a fun story about a girl packing her school supplies, then answer questions to practice comprehension. This first grade School Supplies Reading Comprehension Worksheet includes an answer key to build confident early readers.

A good classmate worksheet that has 1st graders sort six classroom behaviors into kind and unkind, then choose the kind response to two real situations. Answer key included for fast, no-prep character practice.
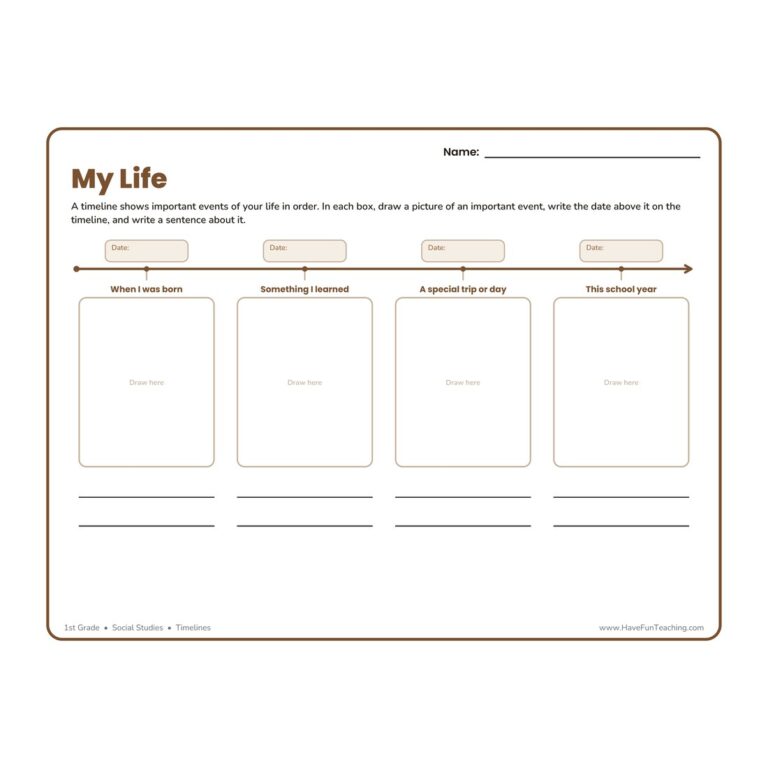
A back to school About Me Timeline Worksheet where 1st graders draw, date, and write four big events from their own life. A fun, no-prep way to teach sequencing and timelines.
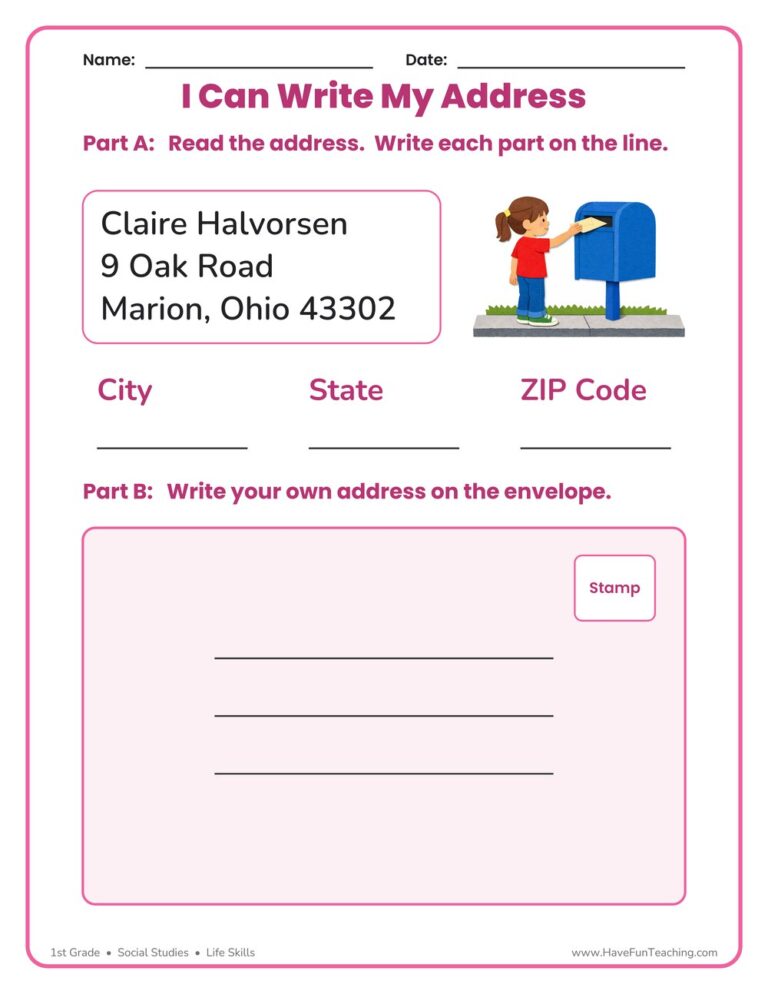
This My Address Envelopes and Letters Worksheet has first graders read a sample address, write the city, state, and ZIP code, then address their own envelope. Answer key included, with no prep beyond printing.

Using this School Subjects Word Wall, students use these common school terms in your word wall to build their vocabulary.
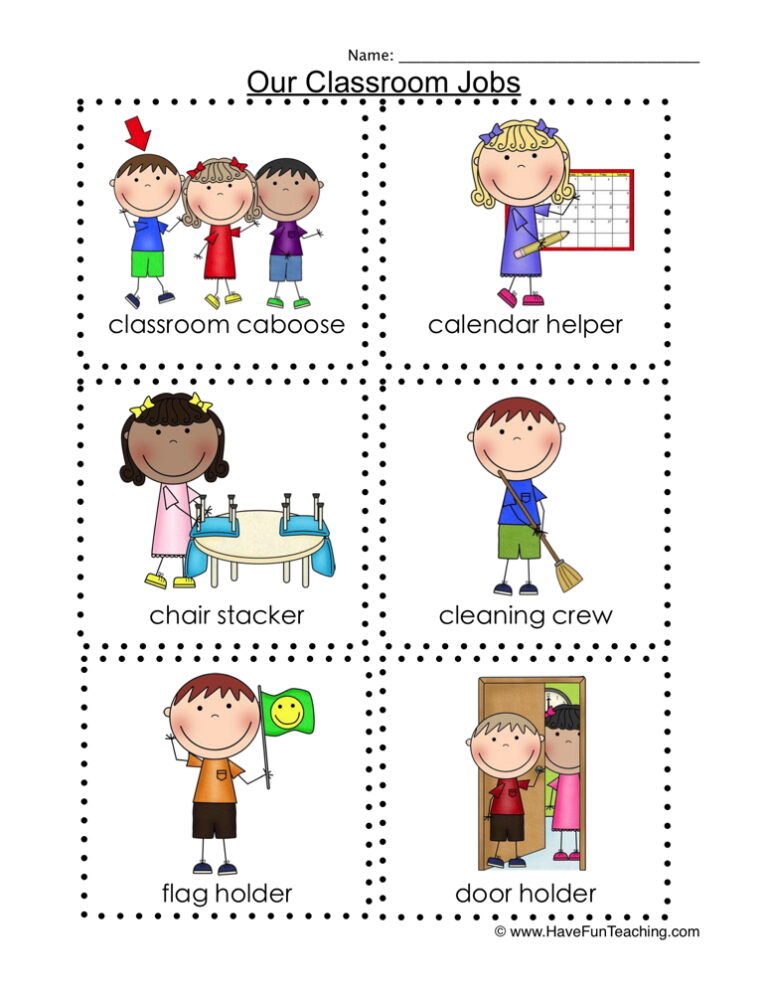
Using these Back to School Classroom Jobs Flash Cards, students know the different jobs that they can help do in your classroom.
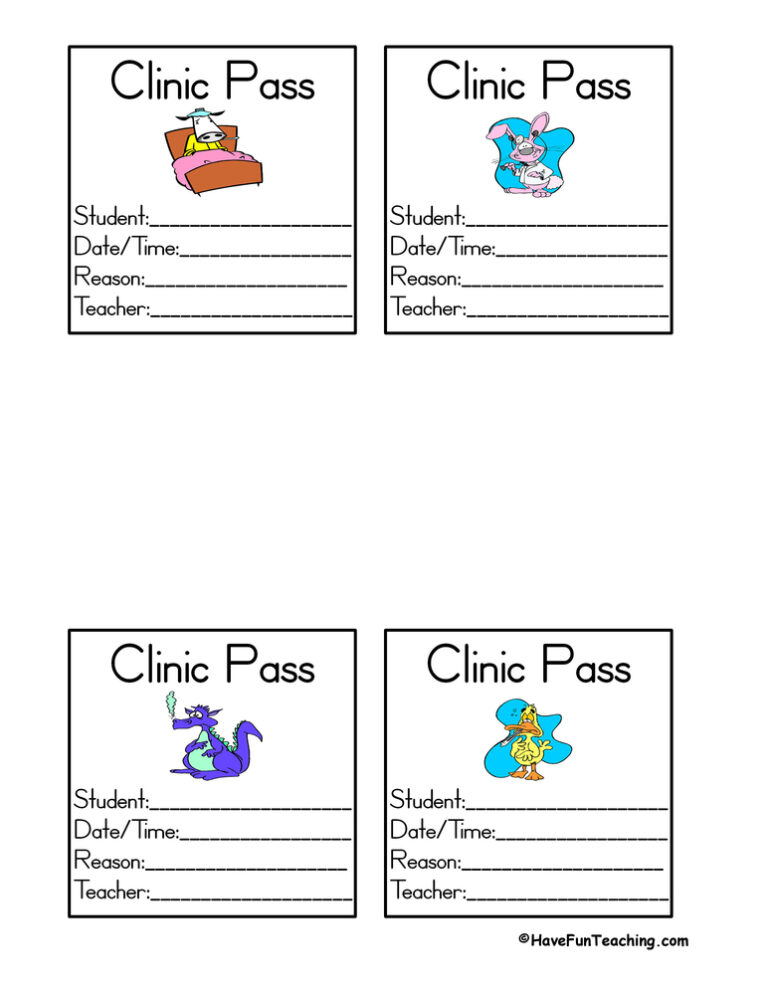
Using this School Hallway Clinic Passes, teachers can quickly write hallway passes so they can keep track of students who go to the nurse, library, or other parts of the school.
This Free First Grade Curriculum plan gives you everything you need to teach every First Grade subject and skill for one year.

Using these Back to School Behavior Flash Cards, students learn examples of good behavior to begin the school year on the right track!

Using these School Supplies Flash Cards, students improve their school supply vocabulary by describing the colorful flash cards.




Reviews
There are no reviews yet