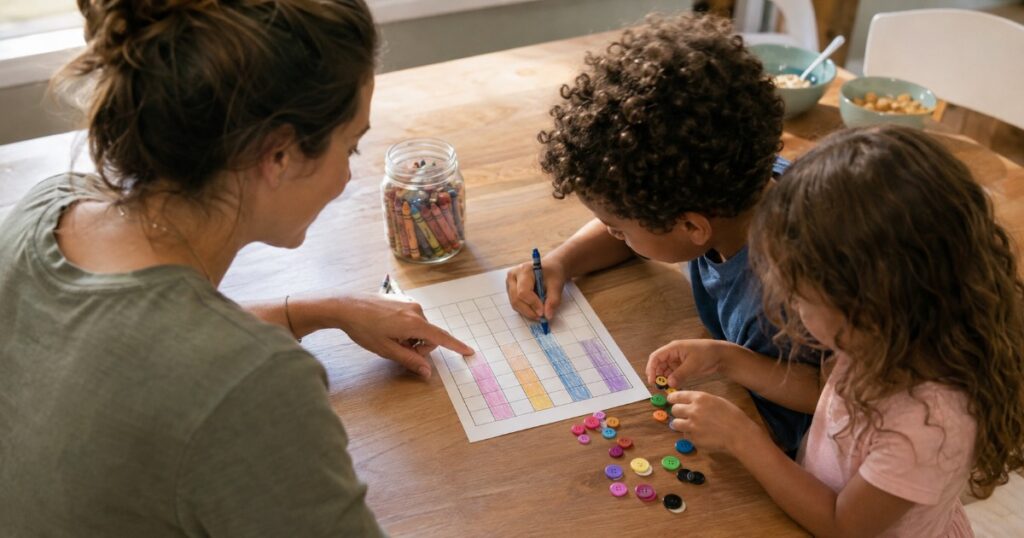
Graphing is one of those skills that looks easy right up until you teach it. Kids can count. Kids can color. But ask them to turn twelve jelly beans into a bar graph and suddenly the columns start in the middle of the page, the labels wander off, and somebody has colored in seven squares for a group of four. Good graphing worksheets fix most of that before it starts, because the grid is already drawn and the question is already asked.
This page walks through what actually works at each grade band, Preschool through 6th, and points you at the specific printables to use. Everything named here is real, it is on the site right now, and most of it takes about ten seconds to print. If tomorrow is unplanned, start at the grade band you need and skip the rest.
The short version
- Graphing is a counting skill first and a math skill second. If the counting is shaky, the graph will be too.
- Preschool through 1st grade: sort real objects, then color one square per object. Nothing abstract yet.
- 2nd and 3rd grade: tally marks, pictographs, and reading a graph someone else made.
- 4th through 6th grade: line plots, scaled bar graphs, pie graphs, and the coordinate plane.
- Have Fun Teaching has 81 graphing resources across worksheets, activities, and Common Core lessons.
Why Graphing Worksheets Beat a Whiteboard Lesson
When you draw a graph on the board, you are asking children to do four things at once: collect the data, remember it, build the axes, and fill in the bars. That is a lot of working memory for a seven-year-old, and the first thing to fall out is usually the math.
Printable graphing worksheets take three of those four jobs off the table. The axes are drawn, the categories are labeled, and the scale is already decided. What is left is the part you actually want to teach — reading the data and representing it honestly. That is why a child who “can’t graph” on the board often does it perfectly on paper.
There is a second reason, and it is less obvious. A worksheet gives you something to look at afterward. You can see, in about four seconds, which child counted correctly but shaded from the top down, and which one invented data. A whiteboard lesson erases itself.
How Do You Teach Graphing to Elementary Students?
In order, and slower than feels necessary. If you are working out how to teach graphing from scratch, the progression below is the one that holds up across a whole elementary program, and skipping a step is the usual reason a class stalls in third grade.
Start with real objects, not squares
Before a single worksheet, sort something. Buttons, crayons, the class’s shoes by color, the cereal in a snack cup. Line the groups up physically so the tallest group is visibly tallest. Children need to see a bar graph as a picture of a real pile before they will believe a colored column means anything. Ten minutes of this saves a week of confusion later.
Then color one square per thing
The bridge from pile to graph is strict one-to-one correspondence — one object, one square, starting at the bottom. Say it out loud every time. Most early graphing errors are not math errors at all; they are a child shading a whole column because it looks nicer that way.
Then read a graph someone else made
This is the step that gets skipped, and it is the one standardized tests care about most. Building a graph and interpreting a graph are separate skills. Give children finished graphs and ask the awkward questions: how many more, how many fewer, how many altogether, which two groups combined beat the biggest one.

Start With Counting — the Skill Every Graph Sits On
Every graphing mistake you will see this year traces back to counting. A child who loses track at eleven will build a beautiful, wrong bar graph. So before the graphing practice starts, spend a few days on counting out loud — and the fastest way to do that with a whole room is to sing it.
Have Fun Teaching’s counting songs cover counting by ones all the way through counting by twelves, plus counting down from twenty. There are 62 counting songs and 64 counting videos on the site, and the whole set is bundled as one album.
-

PreK–3rd · Math
The full counting set in one download — by ones, twos, threes, all the way to twelves, plus counting down. Put it on during morning work and the skip-counting starts showing up in the graphing lesson two weeks later.
Pair it like this: play the song once through, then hand out a graphing worksheet and have children count each column out loud in the same rhythm. The tune carries the one-to-one correspondence for them. More of these live on the Have Fun Teaching YouTube channel.
The Best Free Graphing Worksheets by Grade Band
These are grouped the way you would actually teach them. Every one of them prints on plain paper, and every one has been used by real classrooms — some of these files have been on the site for over a decade.
Preschool through Kindergarten
-
PreK–1st · Math
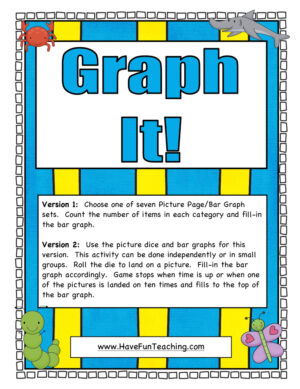
A hands-on first graph. Children sort a small set of pictures into categories and build the columns from the bottom up, so one-to-one correspondence is baked in rather than explained.
-
K–2nd · Math
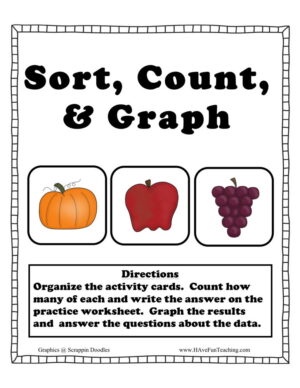
The three steps in the right order, on one page: sort the set, count each group, then graph it. This is the single best sheet to use the very first week.
-
Kindergarten · Math
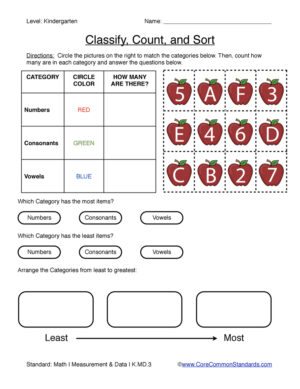
Classify objects into categories and count how many are in each. If you have to show coverage of the kindergarten measurement and data standard, this is the page to file.
1st and 2nd grade
-
K–2nd · Math
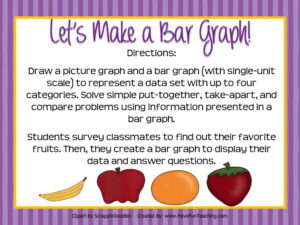
Let’s Make a Bar Graph Activity
Children collect their own data from the room, then build the graph from it. Works beautifully as a partner activity, and it is the first time most kids realize a graph answers a question they asked.
-
1st–4th · Math
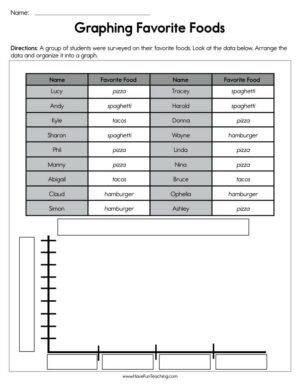
Graphing Favorite Foods Worksheet
Favorite-food data is the friendliest topic in early graphing because every child already has an opinion. Reliable engagement, and it spans four grade levels if you have a split class.
-

2nd Grade · Math
Baking Graphing Tally Marks Worksheet
Tally marks are where counting by fives finally has a job. This sheet moves data from tallies into a graph, which is exactly the translation second graders need practice with.
3rd and 4th grade
-

1st–4th · Math
Organizing Data Using a Pictograph Worksheet
The gentle introduction to scale. One picture can stand for more than one thing, and that idea is a genuine leap — give it a whole lesson, not five minutes.
-

3rd Grade · Math
Making a Pictograph Using Data Worksheet
Now children build the pictograph themselves and choose how much each symbol represents. Watch for the child who picks a scale of one — that is the tell that the concept has not landed yet.
-

3rd–5th · Math
Measurement Data on a Line Plot Worksheet
Line plots connect measuring to graphing, and they are all over third and fourth grade testing. Pair it with a ruler and real objects the first time through.
5th and 6th grade
-

5th Grade · Math
Find Coordinate Pairs Worksheet
The coordinate plane, one ordered pair at a time. Teach “over, then up” as a phrase and repeat it until it is boring — reversed coordinates are the number one error here.
-
5th Grade · Math
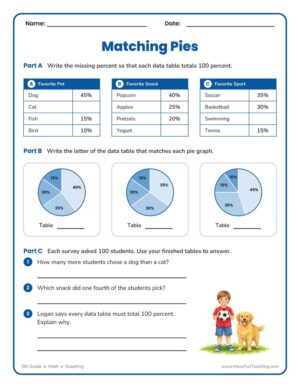
Pie graphs are about proportion, not counting, which is why they feel like a different subject. Matching a data set to the right pie builds the estimation instinct before any fractions get computed.
-
4th–6th · Math
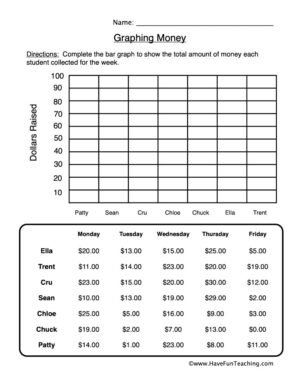
Graphing with decimals, using money because money is the one decimal every child already understands. A good bridge sheet between the data unit and the decimals unit.
Blanks worth keeping in the printer tray
-

1st–5th · Math
A mixed set spanning five grade levels. This is the one to print when you have a split class, a sub day, or a fast finisher who needs something harder.
-
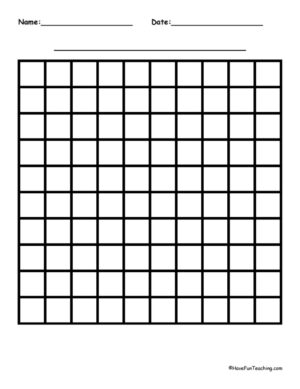
2nd–6th · Math
Big, forgiving squares for children who are still learning to shade inside a line. There are 20, 30, 50, 100, 500 and 1000 grids on the site too, so the paper can grow with them.
-
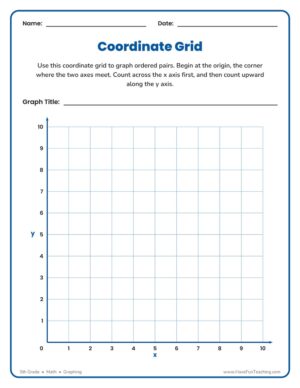
5th–6th · Math
Keep a stack of these. Once children can plot points, mystery-picture coordinate games run themselves and buy you fifteen quiet minutes whenever you need them.
Teacher tip: Print one graphing worksheet, then run it three times with different data — the class’s data, a partner’s data, and made-up data from a story. Children stop treating the sheet as a puzzle with one answer and start treating the graph as a tool. It also saves you two printables.
Ready-to-print
Every graphing worksheet, sorted by grade
Sixty-six printable graphing worksheets plus hands-on activities and Common Core lessons, filtered by grade level so you can find tomorrow’s page in about ten seconds.
Get the Graphing Worksheets Browse free resourcesNo login needed to browse · Preschool–6th · Print in seconds
What to Do When a Child Gets Stuck
Almost every graphing breakdown is one of three things, and each has a fast fix. If the bars are the wrong height, the problem is counting — go back to objects for a day. If the bars are right but the questions are wrong, the problem is interpretation — hand over finished graphs and ask “how many more” until it is automatic. If the whole page is a mess, the problem is the scale — give them bigger squares and fewer categories.
What does not help is more worksheets of the same kind. A child who has misunderstood one-to-one correspondence will misunderstand it eleven more times in a row, and end up believing they are bad at math. Change the format instead: move to printable graphing activities for a few days and come back to paper afterward.
A graph is just a picture of a pile. When a child can point at the tallest bar and tell you which pile it was, the math has already happened.
How Have Fun Teaching Makes Graphing Easier
The library is built so you can find one page fast, at the level you need, without scrolling through a marketplace. There are 81 graphing resources in total: 66 worksheets, 7 hands-on activities and 8 Common Core lessons, spanning Preschool through 6th grade. If you want to see how the whole thing is organized, the math resources section breaks every skill out the same way.
- Filter by grade and skill together, so a 2nd-grade graphing sheet is two clicks away.
- Everything prints on plain paper in black and white — no laminating, no special supplies.
- Worksheets, activities, songs and videos live side by side, so you can switch format when a child stalls.
For extra practice beyond the printables, the National Center for Education Statistics offers a free Create a Graph tool that lets children build bar graphs, line graphs and pie charts on screen. It pairs well with a printed sheet — build it on paper, then check it digitally.
Graphing Worksheets: Common Questions
What grade do kids start learning graphing?
Sorting and simple picture graphs start in preschool and kindergarten, where children classify objects and count each group. Formal bar graphs arrive in 1st grade, pictographs and scaled graphs in 2nd and 3rd, and the coordinate plane in 5th. The underlying skill — organizing information so you can compare it — begins much earlier than most curricula suggest.
Are these graphing worksheets free to print?
Many Have Fun Teaching resources are free to browse and print, and the free collection is open without an account. A membership unlocks the full library of over 10,000 resources across every subject and grade, at $39.97 per year, with a 3-day free trial that does not require a card.
How do I teach graphing to a child who keeps miscounting?
Go back to physical objects for a few days. Have the child move one item into a line as they count it, so the count and the object stay linked. Counting songs help here too, because the rhythm enforces one number per beat. Return to the worksheet once the counting is reliable — the graphing itself is rarely the problem.
Do you have graphing songs or videos?
Graphing itself does not have its own song set, but counting does, and counting is what graphing is built on. There are 62 counting songs and 64 counting videos on the site, including the Counting Songs album, and the Counting By Ones Song alone has over 6.6 million views on the Have Fun Teaching YouTube channel.
What is the difference between a bar graph and a pictograph?
A bar graph uses the height of a column to show quantity, with one square usually equal to one item. A pictograph uses a repeated symbol instead, and each symbol often stands for several items. Pictographs are harder for that reason — they introduce scale, which is a genuine conceptual jump rather than just a different look.
Tomorrow’s math lesson, already printed
Graphing worksheets, activities, songs and lessons for every grade — plus 10,000 more resources across reading, phonics, science and writing. Start free and print tonight.
- 10,000+ ready-to-teach resources
- Preschool–6th grade
- Loved by 2M+ teachers & homeschoolers
No card required to start · Cancel anytime