
Valentine’s Day Graphing Worksheet
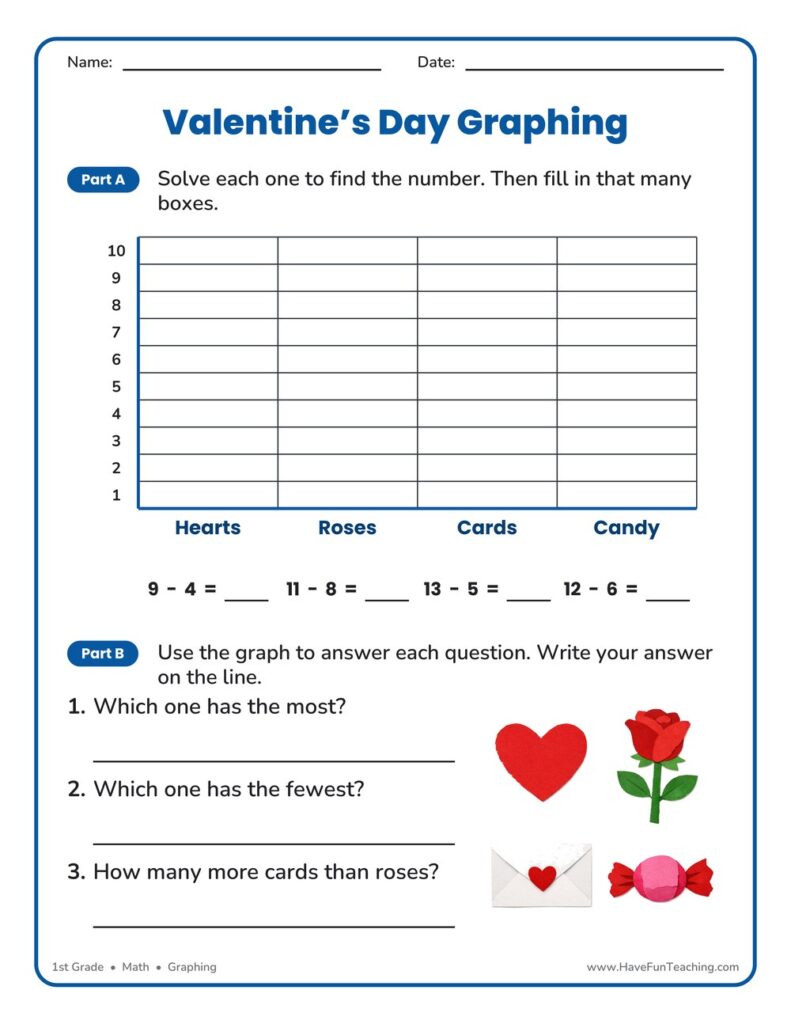
This Valentine’s Day Graphing Worksheet has 1st Grade students solve four subtraction facts, fill in a bar for each answer, and read the graph they built. Answer key included, so checking takes seconds.
$6.97
Or free with a membership — members pay $3.33/mo for all 10,000+ resources. See plans
Want this one free?
Tell us where to send it and it’s yours — no card, no catch.
One free resource per teacher. We’ll also send free teaching ideas each week — unsubscribe anytime.
Teaching is easier with a membership
Unlimited printables, games & videos for PreK–6th — for your classroom or homeschool. Cancel anytime.
Start your 3-day free trial$0 today · cancel anytime · Instant access to 10,000+ resources
About this resource
Description
Reading a bar graph is one of the first real data skills a young child meets, and this Valentine’s Day Graphing Worksheet turns it into a holiday activity. Instead of handing students a finished graph and asking them to read it, this page has them build the graph themselves. They solve four subtraction facts, fill in one column for each answer, and only then start answering questions. Because every bar came from their own work, the graph means something before the first question is asked, and comparing the columns becomes a natural next step rather than a separate exercise.
This first grade graphing worksheet gives students a four-column bar graph scaled from 1 to 10, with hearts, roses, cards, and candy labeled across the bottom. Each category carries its own subtraction problem within 20. Students solve the problem, write the difference on the line, and fill in that many boxes in the column above it. Three follow-up questions then ask which category has the most, which has the fewest, and how many more cards there are than roses. Print it as a Valentine’s Day math center, as morning work in February, or as a quick check on whether students can read a scaled graph without help.
What’s Included
- 1 print-ready PDF worksheet
- Answer key
- 4 subtraction facts within 20, one per graph category
- 1 four-column bar graph scaled from 1 to 10
- 3 graph-reading questions covering most, fewest, and comparison
This Valentine’s Day Graphing Worksheet helps students in three specific ways. First, it links computation to representation: the answer to a subtraction fact is not a dead end but the height of a bar, so children see that numbers describe something. Second, it builds the vocabulary the standards actually test — most, fewest, and how many more — on a graph the child already understands, which is far easier than meeting those words cold on a test. Third, it gives an immediate self-check. A student who miscounts boxes will notice the mismatch when the comparison question does not work out, so the page teaches careful counting without a teacher having to point it out.
Teachers and parents can stretch this activity in a few easy directions. Hand out a small cup of conversation hearts and have children sort them by color, then graph the real counts on the back of the page and ask the same three questions. Take a class survey of favorite Valentine’s treats and build a giant bar graph on chart paper, one sticky note per vote. Ask an older sibling or partner to write a new comparison question for the finished graph and trade papers. For students who need more support, cover all but one column and read that single bar together before opening the whole graph back up.
Related Resources
What teachers say
Reviews
You must be logged in to post a review.

This making a graph using data worksheet has 3rd graders build a scaled bar graph from an orchard data table, then answer four questions about it. An answer key is included, so graphing practice needs no prep.
Using this Bar Graph Activity, students practice using data to create and analyze a bar graph.
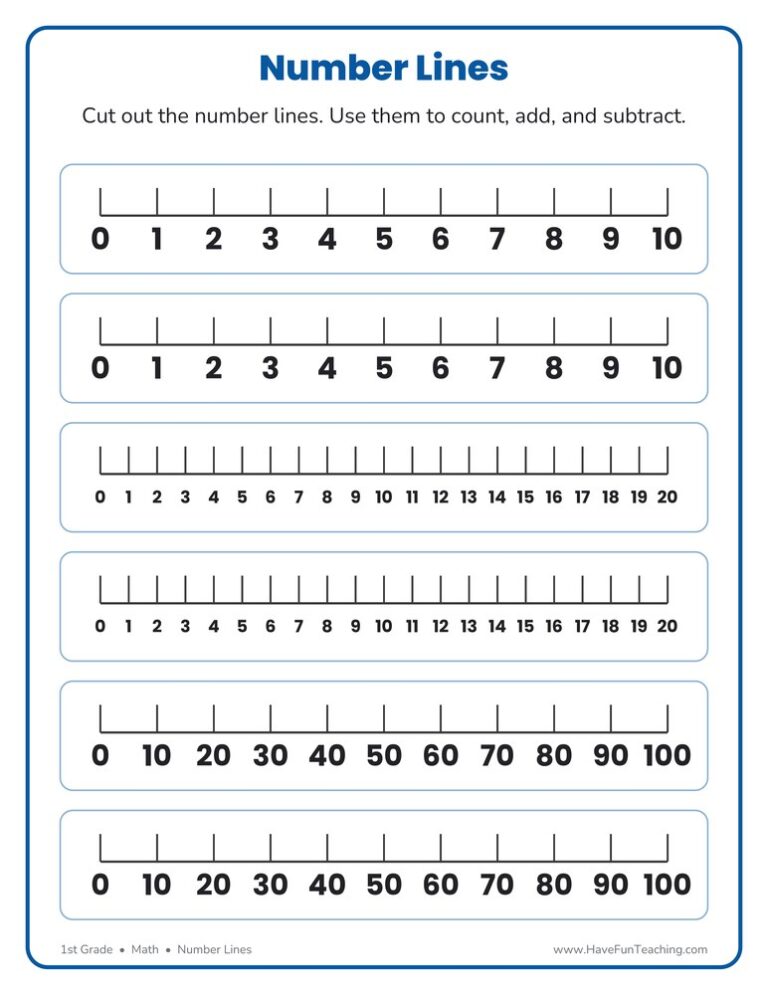
This number lines template worksheet prints six cut-out number lines for 1st grade: two to 10, two to 20, and two counting by tens to 100. Hand one to every student for counting, adding, and subtracting.
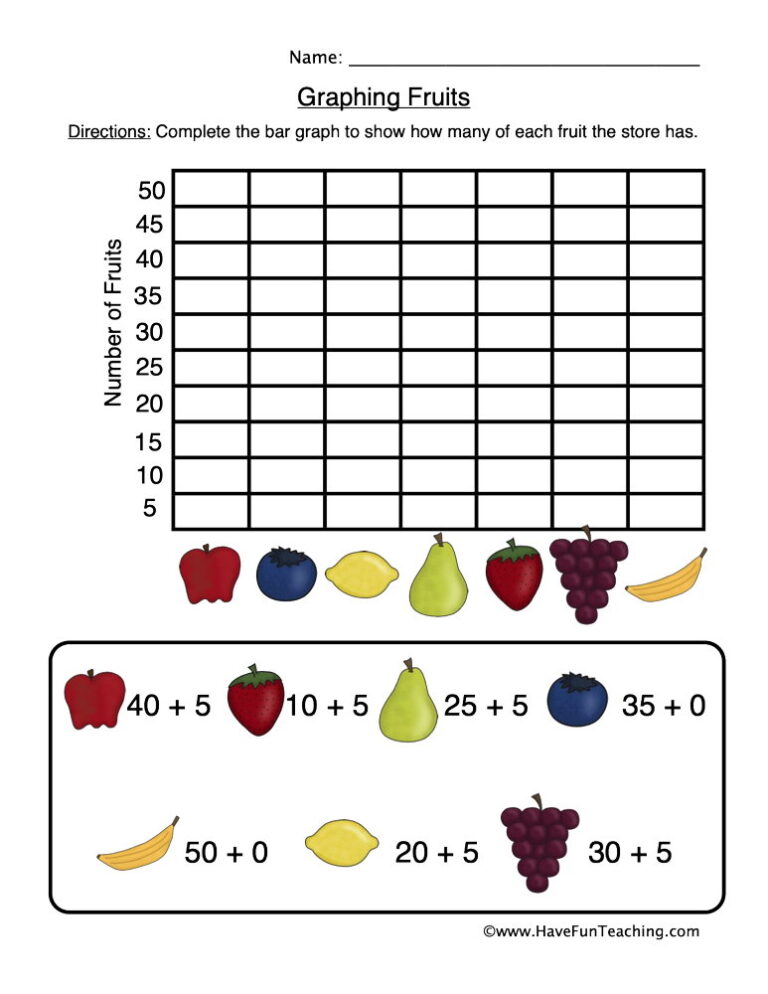
The Graphing Fruits Worksheet has 2nd grade students solve four addition facts, color a bar graph with their answers and read it to answer three questions, with a full answer key.

Using this Summer Graphing Activity, students use the summer spinner to tally what you spin by graphing results.

This Christmas cookies counting tally marks worksheet helps 1st grade students count holiday cookies, draw tally marks and read tally groups by fives. An answer key is included for quick, confident checking.

Using this Sort Count Graph Activity, students count the amount of fruits and vegetables to record them on a graph.

This graphing school tools worksheet has 1st graders count 18 backpacks, markers and rulers, color a bar graph from their own count, and answer three questions about it. Answer key included for fast, no-prep data practice.

Using this Gathering Information from a Graph Worksheet, students answer questions about balloons for a party using the data from the graph.

Using this Graphing Worksheet - Animals, students analyze a pie chart about animals.

Using this Graphing Bugs Worksheet, students analyze the number of bugs at the zoo in a bar graph.

Using this Using a Graph to Gather Information Worksheet, students answer the questions about the farm animals using the data in the graph.




Reviews
There are no reviews yet