Skip to content
Start My 3 Free Days $0 today · cancel anytime

4th Grade Averages Resources

2 4th grade averages resources: 2 worksheets. How teachers use these

4th Grade Averages Resources

2 4th grade averages resources: 2 worksheets. How teachers use these

Worksheet
Worksheet4th GradeAverage State Temperatures Graphing Worksheet

This average state temperatures graphing worksheet has 4th graders read a scaled bar graph of monthly temperatures, then find the average of four of them. Answer key included, so data practice takes no prep.

Worksheet
Worksheet4th GradeFinding Averages Number Set Worksheet

This Finding Averages Number Set Worksheet gives 4th Grade students three real-world number sets to add and divide, with roomy work boxes and a full answer key for quick checking.

From our teachers' playbook

Even it out!

What do 4th graders learn about averages?

Fourth graders meet averages as a way to describe a whole group with one number. If three friends have 2, 4 and 9 stickers, the average is (2 + 4 + 9) ÷ 3 = 5: that's how many each would have if they shared fairly. It's great practice for adding several numbers and for dividing with one-digit divisors. Kids also read averages on graphs, like average monthly temperatures, and talk about what they tell us. The click moment comes when they see the average as the "fair share" instead of just a formula.

Our favorite ways to teach averages

Start with sharing, end with dividing. These moves build the idea before the steps.

Fair-share snack bags

Give three kids different numbers of crackers or counters. They pool everything and split it evenly. Then the class writes the matching number sentence. Sharing first makes "add, then divide" make sense.

Why it works: going from real objects to pictures to symbols is a core recommendation of the U.S. Department of Education's elementary math guide.
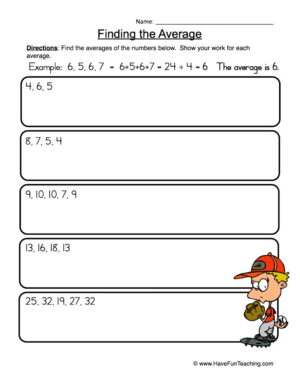
Finding Averages Number Set WorksheetTry it withFinding Averages Number Set WorksheetWorksheetsOpen it →

Average on a graph

Show a bar graph of average temperatures by month. Kids compare the hottest and coldest bars and explain what "average" means for each month. Graphs connect averages to real data.

Why it works: pairing a picture with each word gives kids two ways to remember it, a well-tested principle of how people learn (Mayer, 2009).

Average State Temperatures Graphing WorksheetTry it withAverage State Temperatures Graphing WorksheetWorksheetsOpen it →

Estimate before you compute

Before finding an average, kids guess: will it be closer to the biggest or smallest number? After computing, they check. Quick estimates catch errors.

Why it works: researchers who compared ten study methods found practice testing is one of the two that work best (Dunlosky and colleagues, 2013).

Questions parents and teachers ask about averages

Do 4th graders learn averages?

Many 4th grade classes introduce averages as a fair-share idea, which gives great practice adding and dividing. It becomes a bigger focus in 5th and 6th grade.

How do you explain average to a 4th grader?

Tell them the average is what everyone would get if you shared evenly. Add up all the numbers, then divide by how many there are.

What is a simple average example?

If test scores are 70, 80 and 90, add them to get 240 and divide by 3. The average is 80.

How can I practice averages with my child?

Use everyday numbers like minutes read each day or points in a game. Have your child find the average and say what it means.