
3 days free
Ready for the whole library?
You’ve had your freebie — but members download 10,000+ resources for every grade, all year long. Try it free — $0 today, cancel anytime.
Free for teachers
Pick your grade. We’ll send 10 free resources.
Worksheets, activities and a video — picked for your classroom, ready to print tonight.
One free bundle per teacher. We’ll also send free teaching ideas each week — unsubscribe anytime.




Using this Summer Graphing Activity, students use the summer spinner to tally what you spin by graphing results.

Using this Sort Count Graph Activity, students count the amount of fruits and vegetables to record them on a graph.
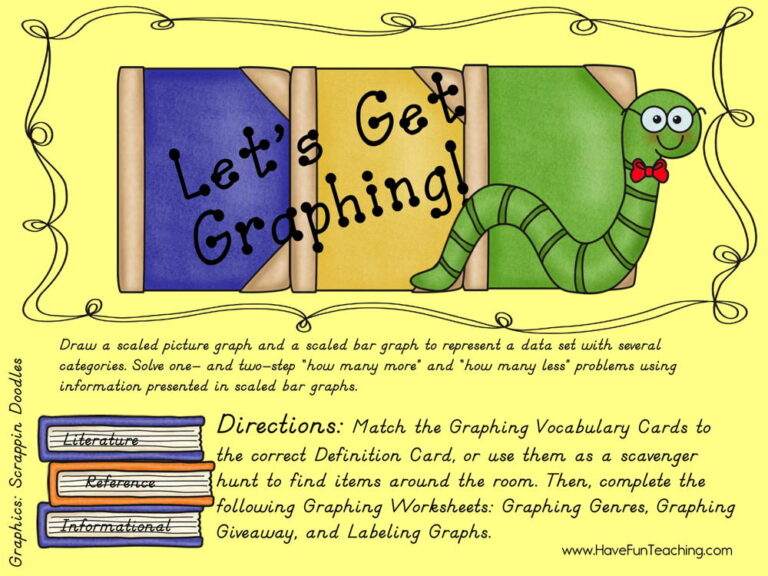
Using this Let's Get Graphing Activity, students solve one- and two-step “how many more” and “how many less” problems using information presented in scaled bar graphs.
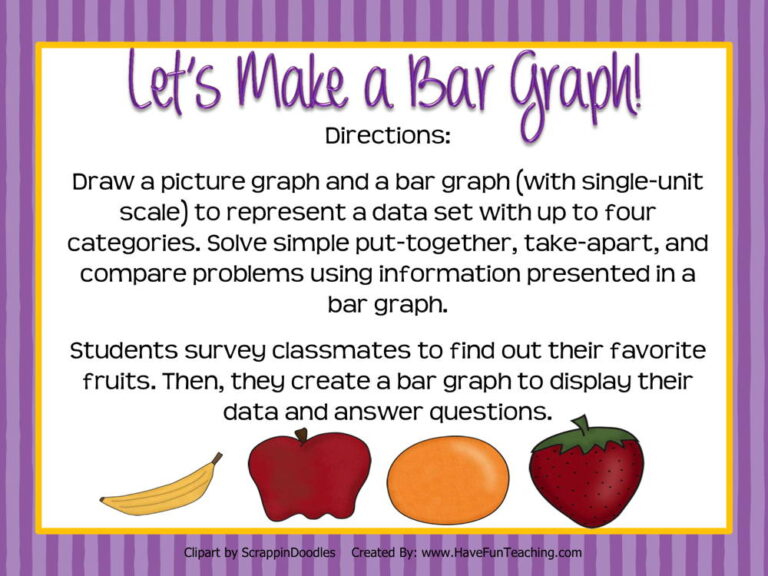
Using this Let's Make a Bar Graph Activity, students draw a picture graph and a bar graph to represent a data set with up to four categories to solve simple put-together, take-apart, and compare problems using information presented in a bar graph.



