

Let’s Make a Bar Graph Activity
Using this Let’s Make a Bar Graph Activity, students draw a picture graph and a bar graph to represent a data set with up to four categories to solve simple put-together, take-apart, and compare problems using information presented in a bar graph.
$6.97
Want this one free?
Tell us where to send it and it’s yours — no card, no catch.
One free resource per teacher. We’ll also send free teaching ideas each week — unsubscribe anytime.
Free teacher account · no credit card
Membership
Get every game, song, & printable
- Every game, on any device
- 6,500+ resources
- Assign online with HFT Classroom
Then $39.97/year · cancel anytime · See plans
- Instant digital download
- Printable PDF + answer key
- Made by real teachers
Teacher / Family membership
Teaching is easier with every resource
One membership for your whole year: 6,500+ worksheets, games, songs and videos for Preschool–6th, for your classroom or homeschool.
- Unlimited printables & downloads
- Every game, on any device
- Assign online with HFT Classroom
- Cancel anytime
Teacher / Family membership · 3 days free
Yearly
Monthly would be $119.64 a year
$3.33/month
Billed $39.97 once a year
You save $79.67 every year
Start My 3 Free Days$0 today · cancel anytime
Monthly
$9.97/month
Flexible, month to month
Yearly is just $3.33/mo. Switch and save $79.67
Start My 3 Free Days$0 today · cancel anytime
About this resource
Description
How to teach Graphing
Using this Let’s Make a Bar Graph Activity, students draw a picture graph and a bar graph to represent a data set with up to four categories to solve simple put-together, take-apart, and compare problems using information presented in a bar graph.
In this activity, students will practice collecting data and recording data on a graph. This activity can be done in as a full class, math centers, in partners or individually.
Students survey classmates to find out their favorite fruits. Then, they create a bar graph to display their data and answer questions.
Other resources to use with this Let’s Make a Bar Graph Activity
If you are using this activity, your students are probably learning about graphing.
Use this Summer Graphing Activity as an additional resource for your students.
Introduce this activity by asking students what it means to graph.Next, create a human graph with your students using student attributes (hair color, shoe colors, etc). Then, students complete the activity independently or with a partner. Finally, students create their own graph using objects from the classroom.
Be sure to check out more Graphing Activities.
Please write a review!
Tell others why you love this resource and how you will use it.
What teachers say
Reviews
Write a review, earn store credit
Get 25¢ in credit for every approved review of a resource you’ve downloaded, played or purchased — up to 15 a month. Credit applies automatically to your membership payments, so your reviews can help pay for your membership.
Honest reviews only — any star rating earns the same. Program rules
Log in to write a review and earn store credit.
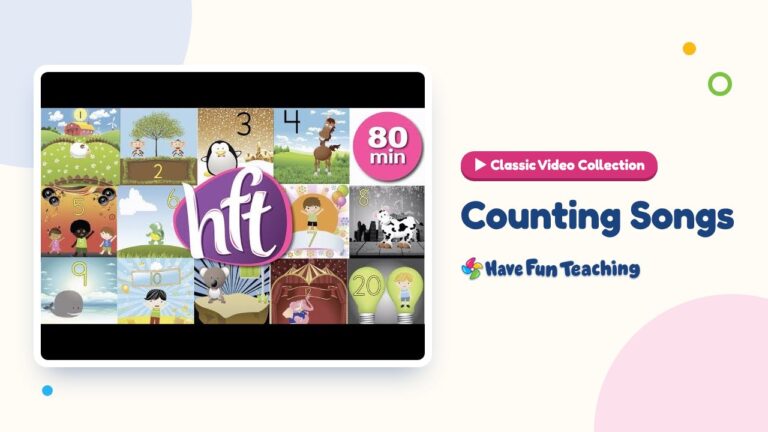
Using the Counting Songs (Classic Video Collection), students practice skip counting by all of the numbers by singing and counting along to these thirteen videos.
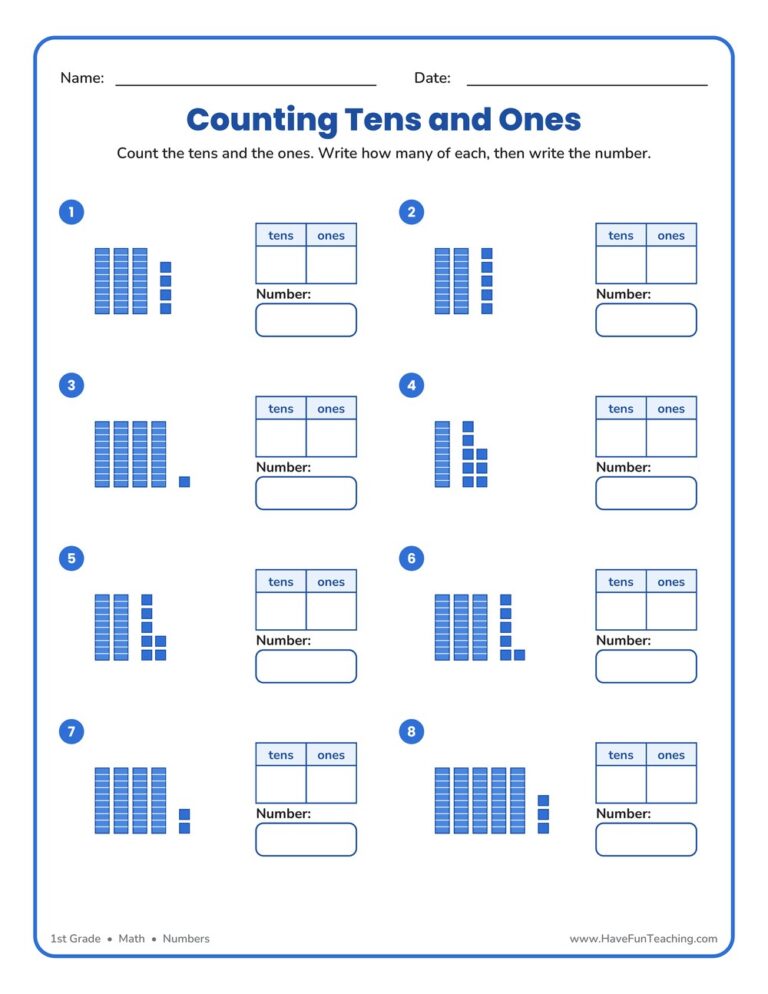
This Counting Tens Ones Worksheet helps first graders count base-ten blocks, record the tens and ones, and write each two-digit number. Includes a complete answer key for quick, no-prep place value practice at home or school.
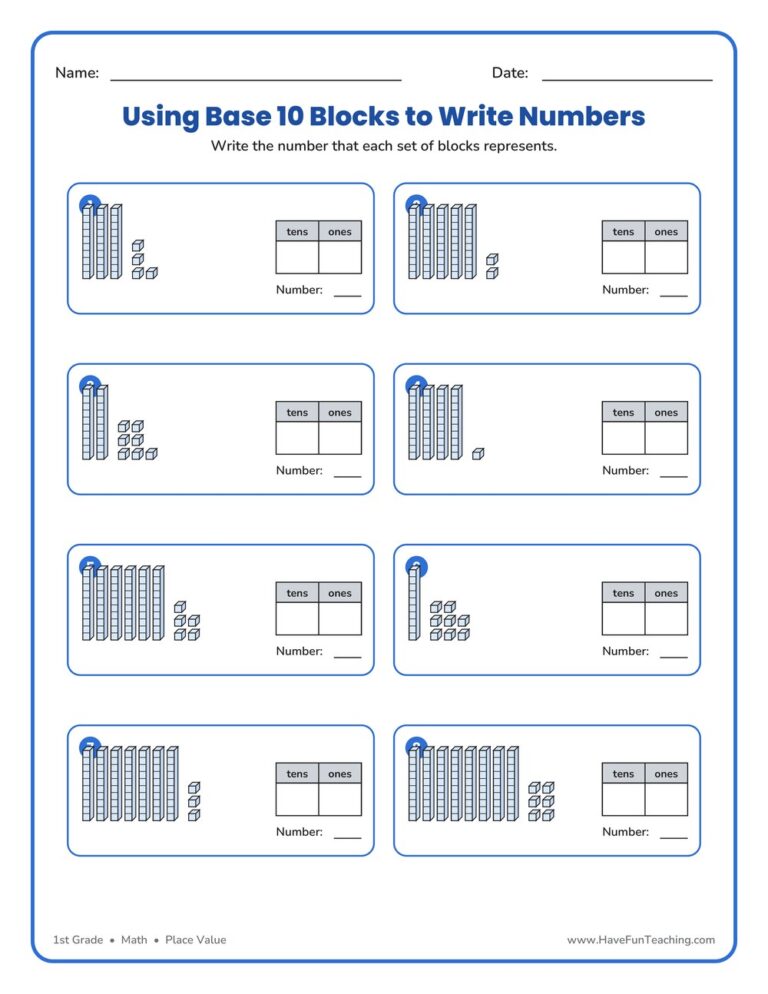
This Using Base 10 Blocks to Write Numbers Worksheet helps 1st graders count tens rods and ones cubes, then record each two-digit number in a place value chart. Includes an answer key for quick, no-prep practice.
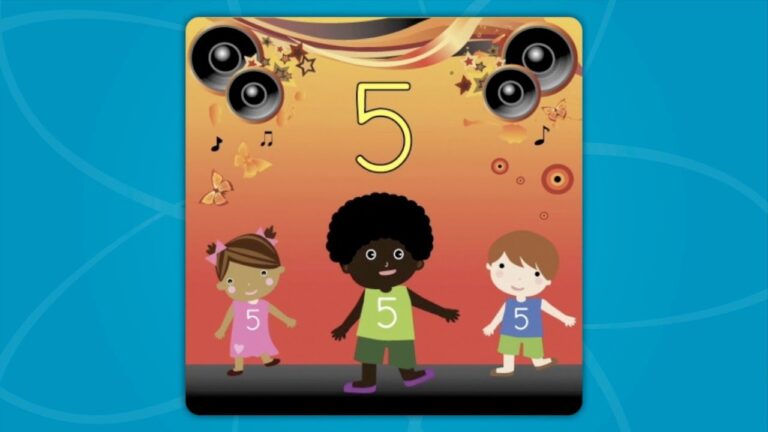
Using the Counting By Fives Song (Original Music Video), students practice skip counting by 5s by singing and counting along to this fun and engaging video!
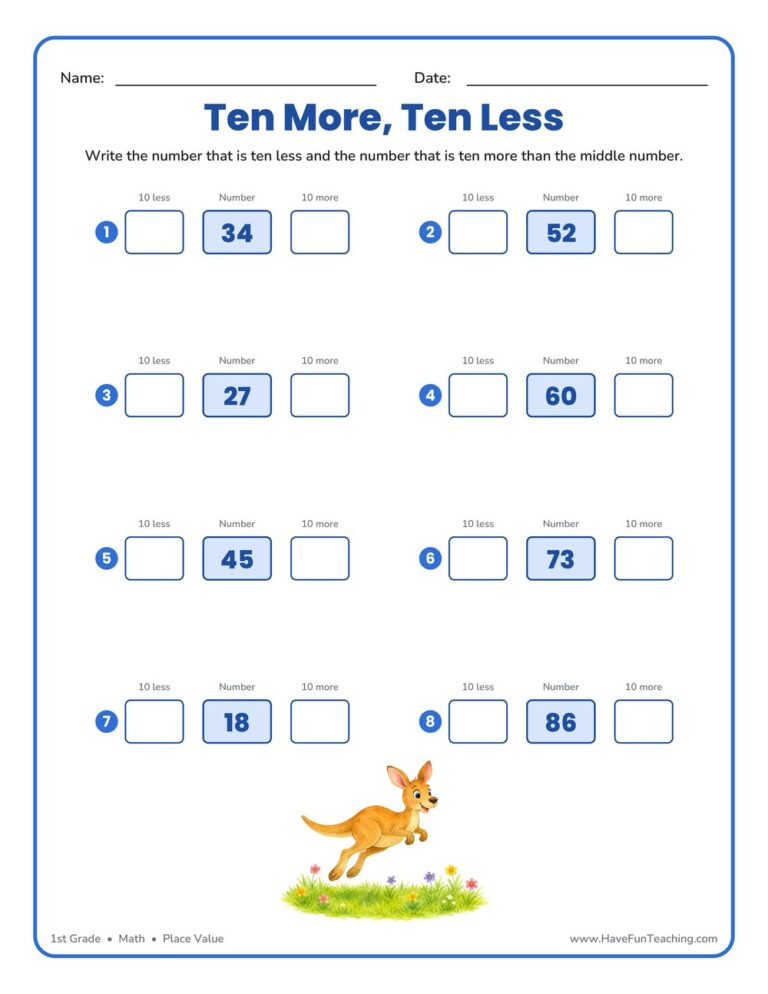
This Ten More Ten Less Worksheet gives 1st graders eight quick problems to find ten more and ten less than a two-digit number. Includes an answer key for fast, no-prep place value practice.

Using the Counting By Twos Song (Original Music Video), students practice skip counting by 2s by singing and counting along to this fun and engaging video!

This counting on to add worksheet helps 1st graders start from the bigger number and count forward on a number line to twenty. An answer key is included, so checking work takes seconds.
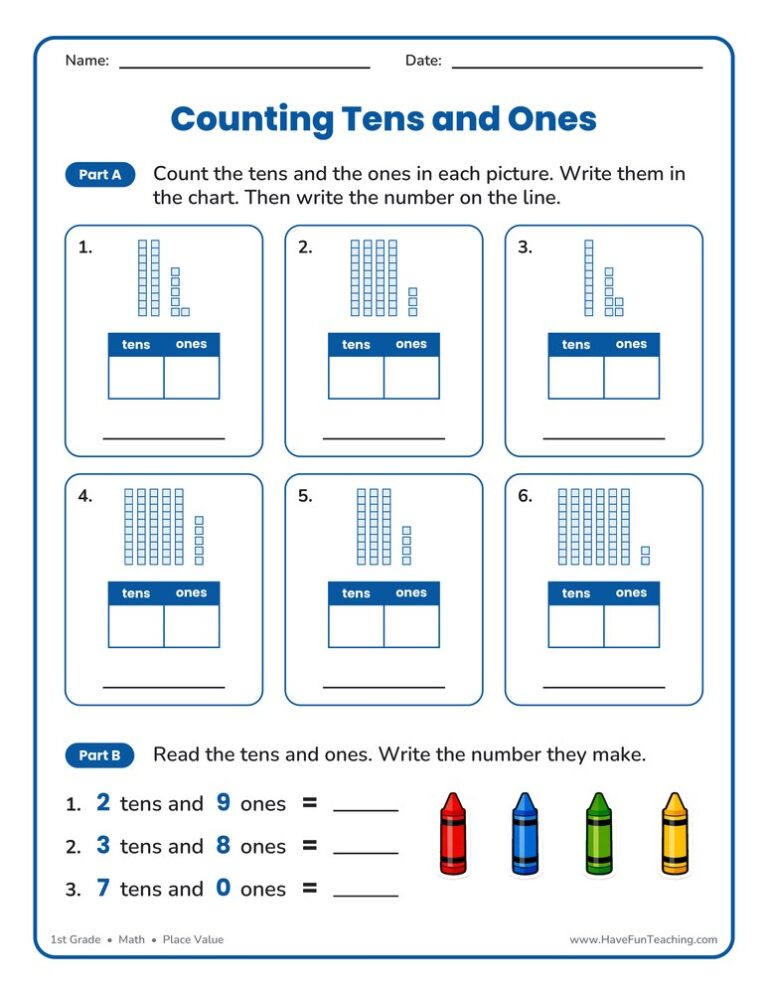
This count tens and ones worksheet gives 1st grade students base ten block pictures to count, chart, and write as numbers. An answer key is included, so place value practice is ready to print and go.

Using the Counting By Ones Song, students practice counting by ones to fifty by singing and counting along to this fun and engaging video!

This counting back to subtract worksheet gives 1st graders number-line hops, six equations within 20, and a word problem, with an answer key included, so subtraction becomes a quick, confident count.
Using the Counting By Ones Song (Original Music Video), students practice counting by 1s by singing and counting along to this fun and engaging video!

This finding the missing number worksheet gives first graders focused practice solving for the unknown number in addition and subtraction equations within 20. Includes an answer key — a quick, no-prep way to build number sense and fact fluency.
Reviews
There are no reviews yet