
Seasons Explanations Worksheet
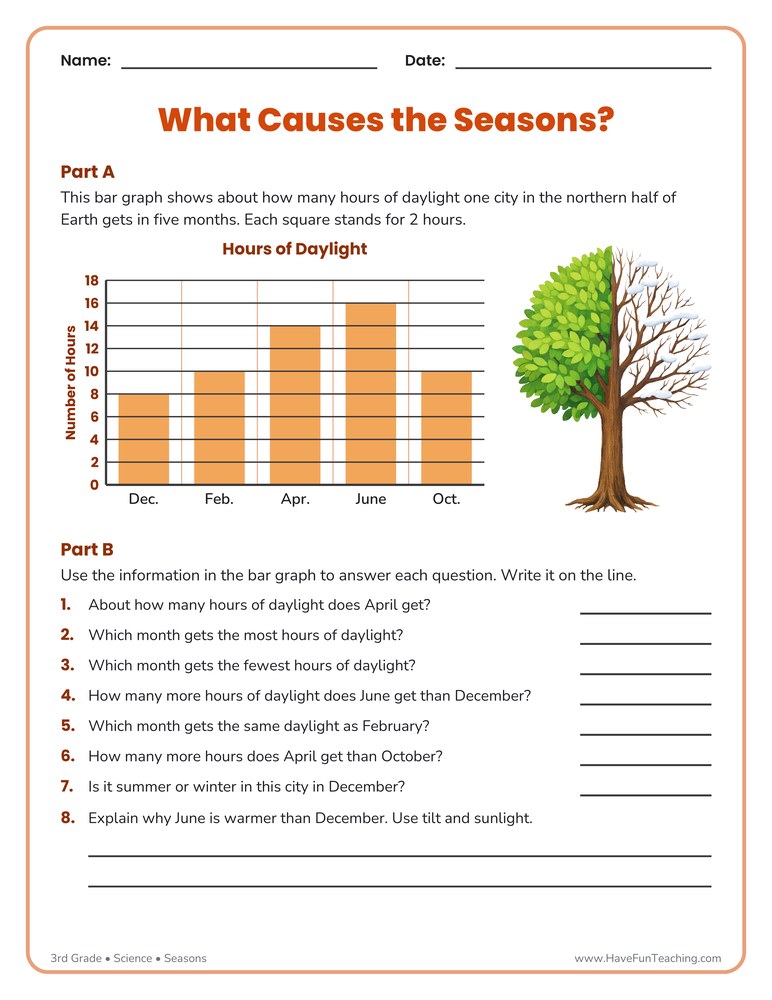
This seasons explanations worksheet has 3rd graders read a bar graph of daylight hours and explain how Earth’s tilt causes warm and cold seasons. An answer key is included.
$6.97
Want this one free?
Tell us where to send it and it’s yours — no card, no catch.
One free resource per teacher. We’ll also send free teaching ideas each week — unsubscribe anytime.
Free teacher account · no credit card
Membership
Get every game, song, & printable
- Every game, on any device
- 6,500+ resources
- Assign online with HFT Classroom
Then $39.97/year · cancel anytime · See plans
- Instant digital download
- Printable PDF + answer key
- Made by real teachers
Teacher / Family membership
Teaching is easier with every resource
One membership for your whole year: 6,500+ worksheets, games, songs and videos for Preschool–6th, for your classroom or homeschool.
- Unlimited printables & downloads
- Every game, on any device
- Assign online with HFT Classroom
- Cancel anytime
Teacher / Family membership · 3 days free
Yearly
Monthly would be $119.64 a year
$3.33/month
Billed $39.97 once a year
You save $79.67 every year
Start My 3 Free Days$0 today · cancel anytime
Monthly
$9.97/month
Flexible, month to month
Yearly is just $3.33/mo. Switch and save $79.67
Start My 3 Free Days$0 today · cancel anytime
About this resource
Description
Why is summer warm and winter cold? Earth’s tilt means one half of Earth leans toward the Sun for part of the year and away from it for another part, and that changes how long the days are and how strongly sunlight warms the ground. This seasons explanations worksheet helps third graders see that idea in real data by reading a bar graph of daylight hours.
About This Worksheet
In Part A, students study a printed bar graph that shows about how many hours of daylight one city in the northern half of Earth gets in December, February, April, June and October. Each square on the scaled graph stands for two hours, so children must count carefully. In Part B, they answer seven questions about the graph, such as which month gets the most daylight and how many more hours June gets than December. The last question asks them to explain why June is warmer than December using the words tilt and sunlight. A complete answer key is on page two.
What’s Included
- One worksheet page with a scaled bar graph of daylight hours
- Seven read-the-graph questions with answer lines
- One short written explanation about tilt and sunlight
- A complete answer key
Why It Helps Kids Learn
- It links the cause of the seasons to data children can read and compare.
- Reading a scaled bar graph builds math and science skills together.
- Writing an explanation with science words strengthens understanding.
Ideas for Teachers and Parents
Before the worksheet, shine a flashlight on a tilted globe so students can see one half lean toward the light. After they finish, ask them to predict the daylight for August and explain their thinking. This 3rd grade seasons worksheet fits a weather unit, a science center or homework. Use the seasons explanations worksheet beside a short lesson on how the Sun warms Earth.
Related Resources
What teachers say
Reviews
Write a review, earn store credit
Get 25¢ in credit for every approved review of a resource you’ve downloaded, played or purchased — up to 15 a month. Credit applies automatically to your membership payments, so your reviews can help pay for your membership.
Honest reviews only — any star rating earns the same. Program rules
Log in to write a review and earn store credit.

The Seasons Song by Have Fun Teaching is perfect for teaching and learning all about the seasons of the year. This is a fun way for kids to learn the seasons. With this seasons song, your kids can learn about Spring, Summer, Fall, and Winter. While listening to the Seasons…
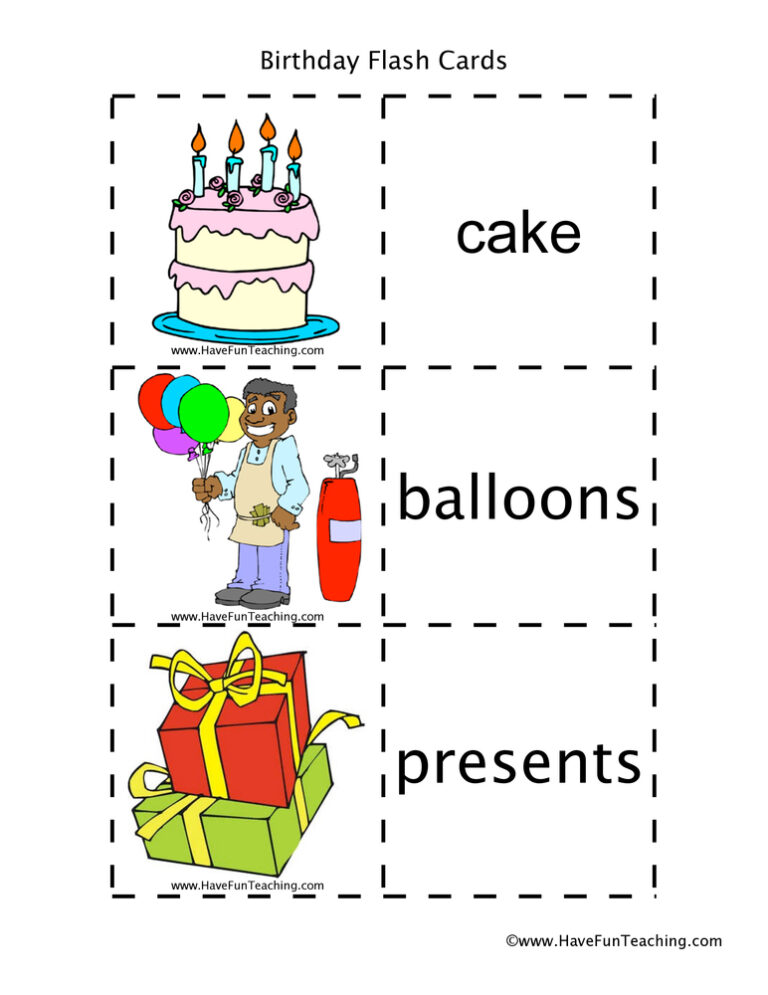
These birthday flash cards help preschool to 4th grade students learn 24 party words like cake, candles and presents. Fold-over picture cards, a practice page and an answer key are included.

While listening to the Seasons Song (MP3), students learn about the seasons of the year while listening to a catchy song.

Using Plurals Activity, students add the proper word ending to make a plural noun for correct usage in writing.

This seasons drawing worksheet has 3rd graders draw one tree across winter, spring, summer and fall, then describe each season's weather in their own state to build real science observation skills.
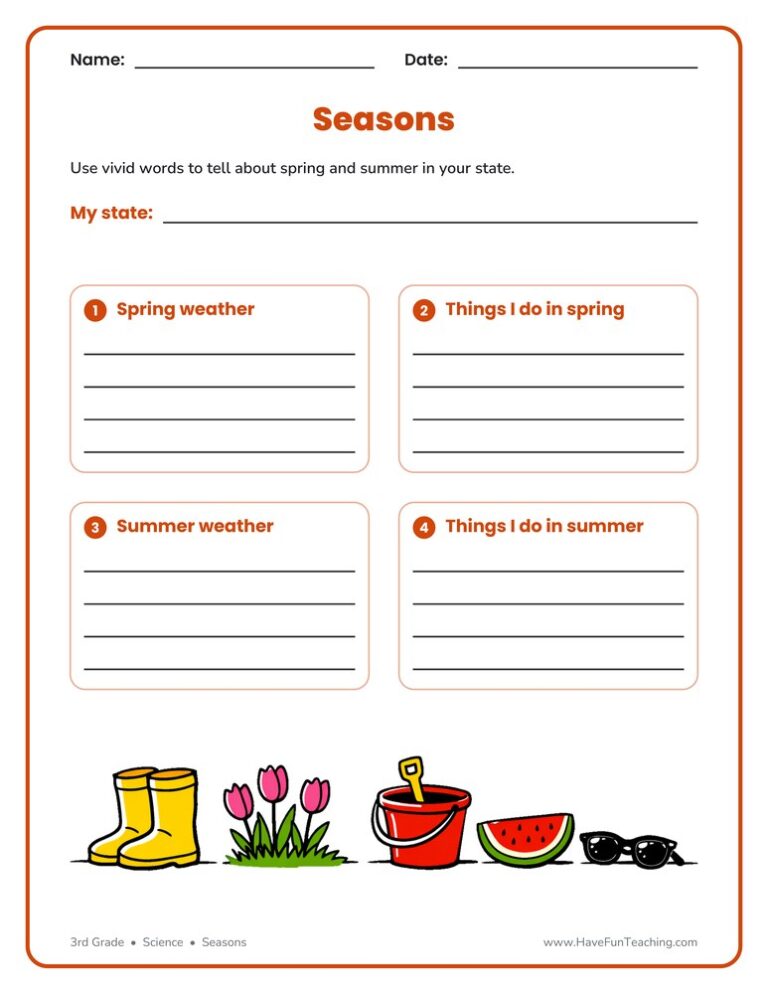
This seasons writing worksheet has 3rd graders describe spring and summer weather and activities in their own state, building vivid word choice and real science observation skills.

This common and proper nouns activity has 1st to 3rd grade students sort snowflake word cards on a winter mat, with a practice page and answer key included for easy checking.
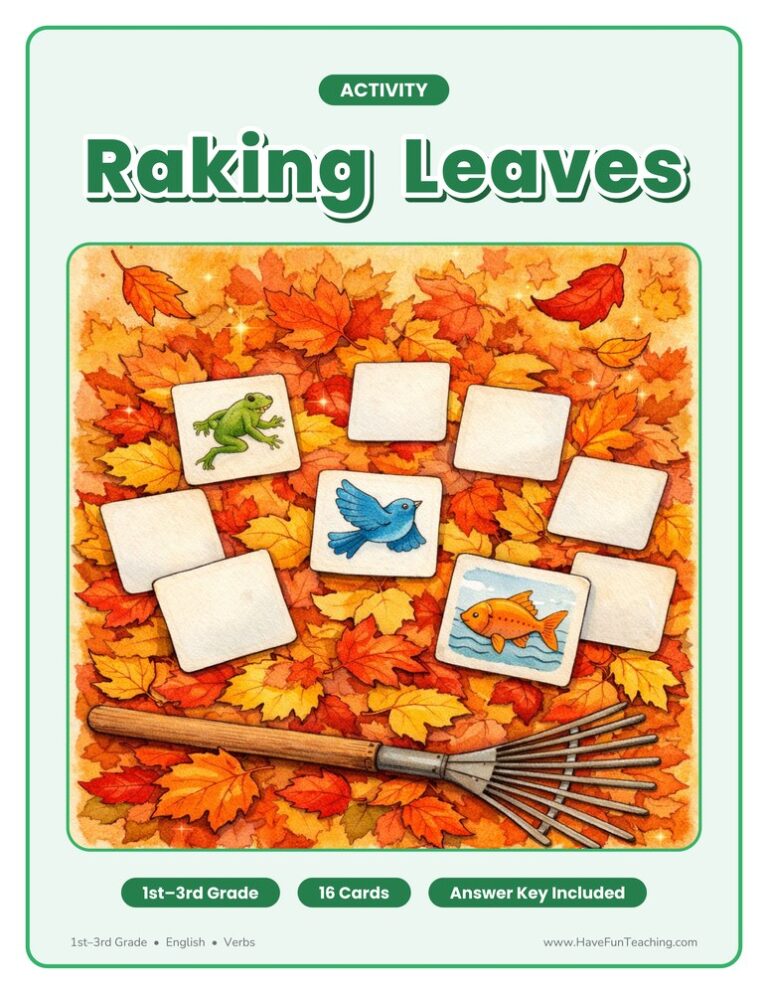
This raking leaves verbs activity has 1st to 3rd grade children match fall action pictures to verbs in a memory game, then complete sentences. Answer key included.

A summer story worksheet where 3rd graders read about three friends beating the heat, then answer main idea, sequence, and detail questions. This Staying Cool Reading Comprehension Worksheet includes an answer key for fast, no-prep practice.

These Mother's Day flash cards teach 15 holiday words with a picture on the front and the word inside. Made for Preschool to 4th Grade, with a practice page and answer key included.

Using this Seasons of the Year Mini Pack, students learn about Seasons through ten fun worksheets and five activities.
Reviews
There are no reviews yet