

Graphing Coordinates Equations Worksheet
This Graphing Coordinates Equations Worksheet has 5th graders solve a function table, plot the ordered pairs on a grid, and explain the pattern. Answer key included for fast, no-prep coordinate practice.
$6.97
Or free with a membership — members pay $3.33/mo for all 10,000+ resources. See plans
Want this one free?
Tell us where to send it and it’s yours — no card, no catch.
One free resource per teacher. We’ll also send free teaching ideas each week — unsubscribe anytime.
Teaching is easier with a membership
Unlimited printables, games & videos for PreK–6th — for your classroom or homeschool. Cancel anytime.
Start your 3-day free trial$0 today · cancel anytime · Instant access to 10,000+ resources
About this resource
Description
Plotting points on a coordinate grid is one of the biggest steps a fifth grader takes in math, because it turns a list of numbers into a picture. This Graphing Coordinates Equations Worksheet asks students to solve a simple equation for several values of x, record each y-coordinate, and write the matching ordered pair. Once the pairs are on paper, students plot them on a first-quadrant grid and see the pattern the rule creates. Working from a function table to a graph builds the exact reasoning the standards ask for: generating a number pattern from a rule and graphing the ordered pairs that result.
This 5th grade graphing worksheet is organized into three short parts so students move from calculating to plotting to explaining. Part A gives one completed example row and then four rows to finish. Part B provides a clean, labeled coordinate grid for plotting and labeling all five ordered pairs. Part C asks three questions that push past the graph: describe the pattern in the y-coordinates, apply the rule to a value that falls off the grid, and find the mistake in another student’s answer. Use it as a lesson follow-up, a math-center task, morning work, or a quick check before a unit test.
What’s Included
- 1 print-ready PDF worksheet
- Answer key
- A 5-row function table, a first-quadrant coordinate grid, and 3 short-response questions
This Graphing Coordinates Equations Worksheet helps students in three ways. First, the function table keeps the arithmetic and the graphing side by side, so students see that every ordered pair comes from the rule rather than from guessing. Second, plotting and labeling each point builds precision with the x-axis and the y-axis, which is exactly where most graphing errors begin. Third, the error-analysis question asks students to explain their thinking in writing, which turns a plotting exercise into real mathematical reasoning a teacher can assess at a glance.
Teachers and parents can stretch this skill in simple ways. Put masking tape on the floor to build a giant grid, then call out ordered pairs for students to stand on. Give students a brand-new rule and let them build their own table and graph, then trade papers with a partner to check the work. Play a coordinate-grid guessing game on graph paper, or hide a treasure on a grid and write the clues as ordered pairs. Before plotting the last point, ask students to predict where it will land and then confirm it with the rule.
Related Resources
What teachers say
Reviews
You must be logged in to post a review.
This 50 by 50 blank graph paper gives 5th grade math students a clean, pre-numbered coordinate grid (0 to 50 by fives) for plotting points and graphing data. Two ready-to-print grid pages make neat, accurate graphs simple at home or school.
This 30 by 30 blank graph paper gives 5th graders a large, reusable grid for graphing and plotting points. Print it for coordinate plotting, bar graphs, geometry, and everyday math practice.
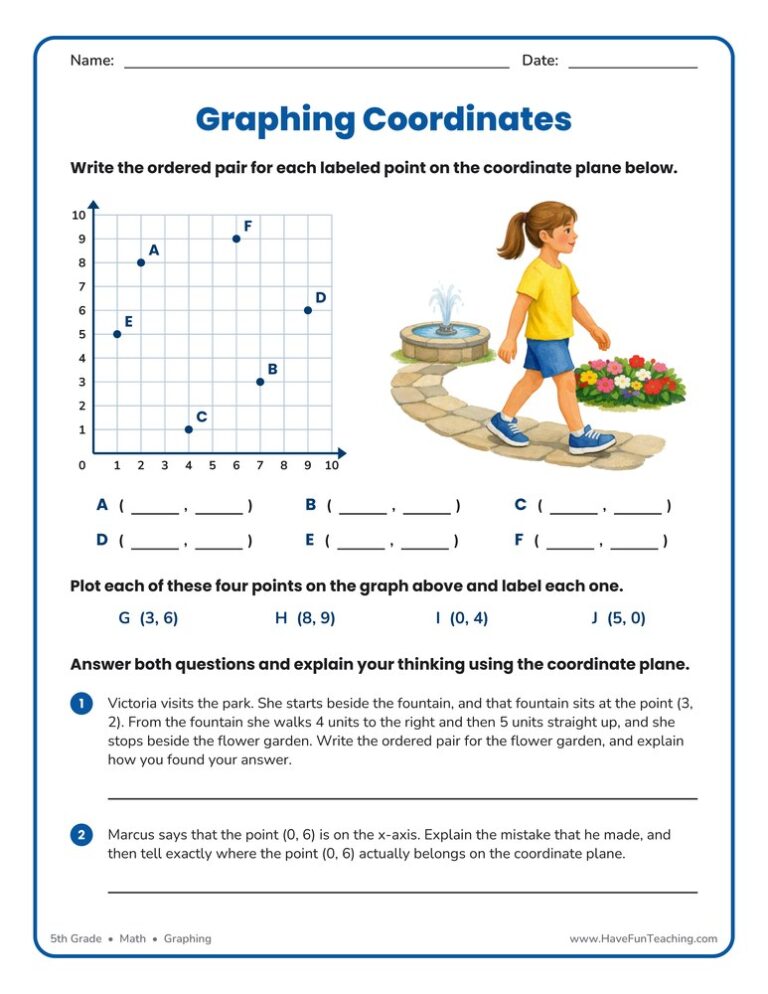
This Plotting Graphing Coordinates Worksheet gives 5th Grade students practice naming and plotting points on a coordinate plane. An answer key is included, so children can check their own work and build confidence fast.
Use this blank coordinate grid to help 5th Grade students plot ordered pairs on a first-quadrant coordinate plane. A reusable graphing template for lessons, warm-ups, and math centers.

A garden-themed Find Coordinate Pairs Worksheet where 5th graders write ordered pairs for plotted points, then plot and connect four corners to find a perimeter. Answer key included for fast, no-prep graphing practice.
This 1000 by 1000 blank graph paper gives 5th grade students a first-quadrant grid with both axes numbered to 1000, plus title and label lines, so any data set is easy to plot.
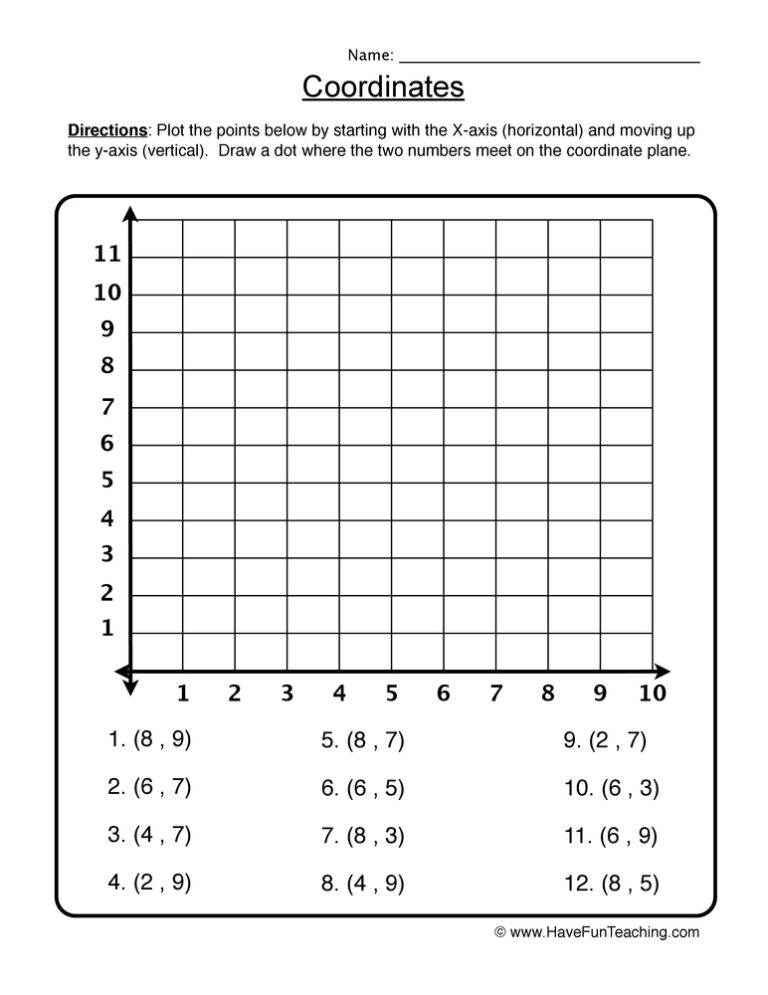
This Use Coordinate Pairs Worksheet asks 5th graders to name four plotted points, plot four more ordered pairs on the same grid, and explain their thinking. An answer key is included for fast, no-prep graphing practice.

This 500 by 500 blank graph paper worksheet gives 5th grade students a first quadrant grid numbered by fifties, with title and axis label rules, so they can plot and graph their own data with confidence.
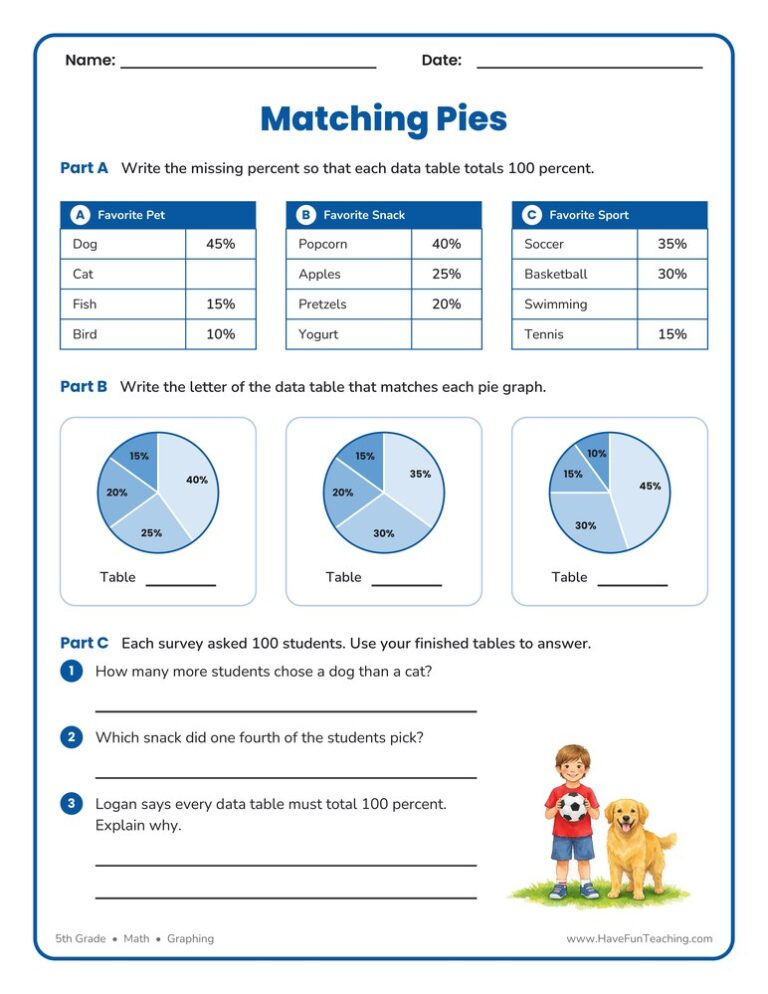
This Matching Pie Graphs Worksheet has 5th Grade students complete three data tables, match each table to its pie graph, and answer three questions. An answer key is included, so practice with circle graphs is easy to check.

Using this Graphing Measurements Worksheet, students measure the objects below to create a line graph that shows growth over time.
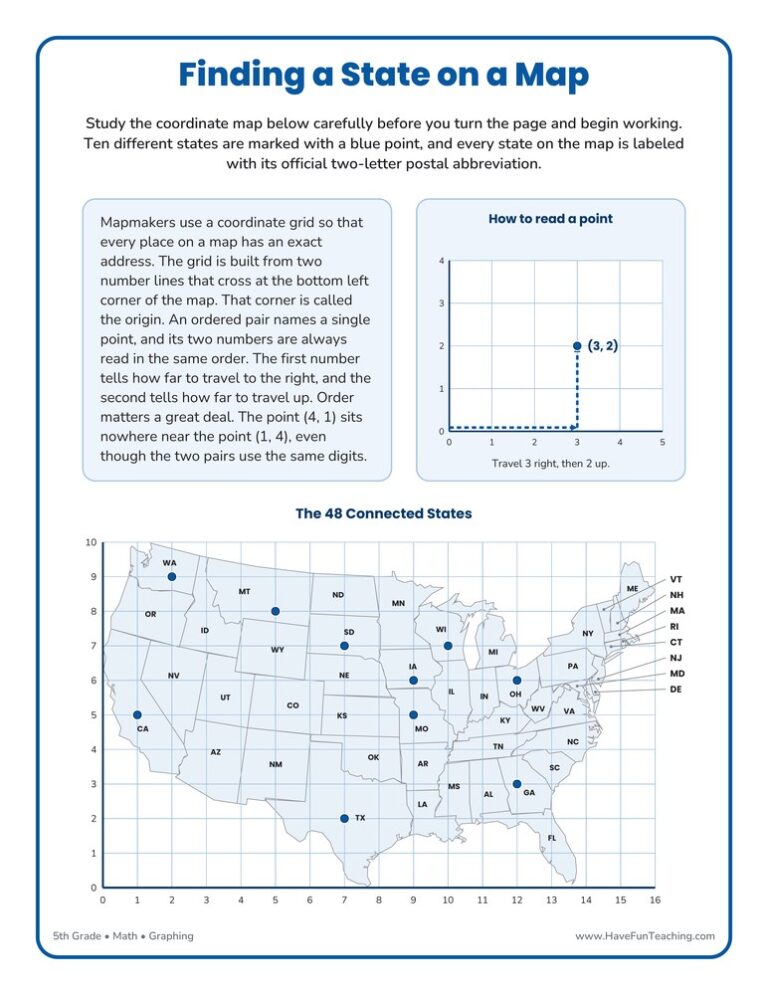
This Finding a State on a Map Worksheet gives 5th grade students a coordinate grid drawn over a United States map, plus a full answer key, so ordered pairs finally point at real places.

This Decimals Bar Graphs Worksheet asks 5th Grade students to add and subtract decimals to hundredths, then shade a bar to each answer on a 0.00 to 1.00 scale. An answer key is included.




Reviews
There are no reviews yet