

Decimals Bar Graphs Worksheet
This Decimals Bar Graphs Worksheet asks 5th Grade students to add and subtract decimals to hundredths, then shade a bar to each answer on a 0.00 to 1.00 scale. An answer key is included.
$6.97
Or free with a membership — members pay $3.33/mo for all 10,000+ resources. See plans
Want this one free?
Tell us where to send it and it’s yours — no card, no catch.
One free resource per teacher. We’ll also send free teaching ideas each week — unsubscribe anytime.
Teaching is easier with a membership
Unlimited printables, games & videos for PreK–6th — for your classroom or homeschool. Cancel anytime.
Start your 3-day free trial$0 today · cancel anytime · Instant access to 10,000+ resources
About this resource
Description
Decimals stop being abstract the moment a student has to show one on a graph. This Decimals Bar Graphs Worksheet joins two 5th Grade skills that are usually taught apart: adding and subtracting decimals to hundredths, and representing a value accurately on a scaled bar graph. Students compute an answer, find it on a scale that climbs from 0.00 to 1.00, and shade a bar to exactly that height — so a careless hundredth is not just marked wrong, it is visibly the wrong size next to the bars around it.
Part A gives eight lettered problems, A through H. Some are two-addend sums, some are three-addend sums, and some are subtractions that cross a whole number, such as 1.30 − 0.55 and 1.00 − 0.15. Students write each sum or difference on the line beside it. Part B is a full-page bar graph ruled in hundredths, with a bold line every tenth and a light line every five hundredths, and one column for every problem letter. Students shade one bar per letter to the height of their answer. Every answer in this set lands exactly on a ruled gridline, so a correct bar always meets a line and a wrong one never does.
What’s Included
- 1 print-ready PDF worksheet
- Answer key with every bar shaded
- 8 decimal addition and subtraction problems
- A scaled bar graph from 0.00 to 1.00 with 8 lettered columns
This Decimals Bar Graphs Worksheet helps students in three ways. First, it makes the size of a decimal visible: 0.30 and 0.90 look nothing alike as bars, which builds the number sense that lining up decimal points alone never teaches. Second, the graph is self-checking, because an answer that misses a gridline signals an arithmetic slip before the teacher ever sees the page. Third, reading a scale in hundredths is exactly the measurement skill state tests use, so the graphing half is not decoration — it is a second standard practised in the same ten minutes.
Teachers and parents can extend this decimal bar graph worksheet easily. Ask students to rank the bars from shortest to tallest and write the letters in order, or to name the two bars whose difference is closest to 0.10. Have partners cover Part A and try to work backwards from the graph to a possible problem. Bring in real data — batting averages, rainfall in inches, the price of four snacks — and graph it on the same scale. For a quick challenge, ask which two answers could be added without going over 1.00.
Related Resources
What teachers say
Reviews
You must be logged in to post a review.
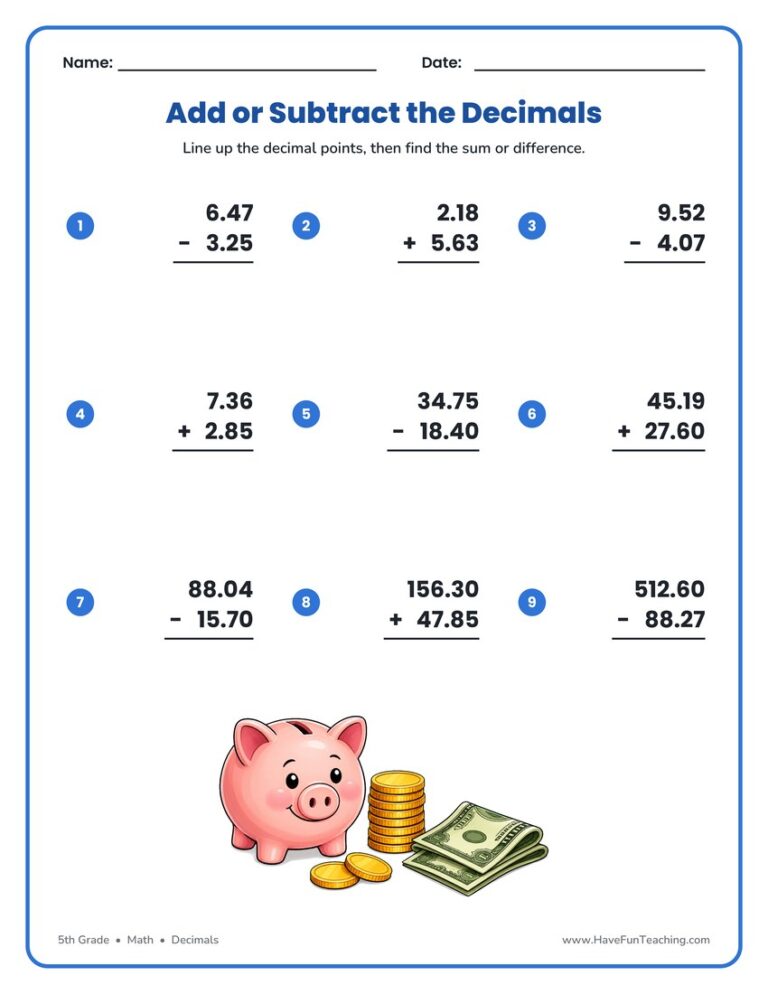
Fifth graders practice adding and subtracting decimals on this add/subtract decimals worksheet with nine aligned column problems. Includes a complete answer key for quick, no-prep math practice.
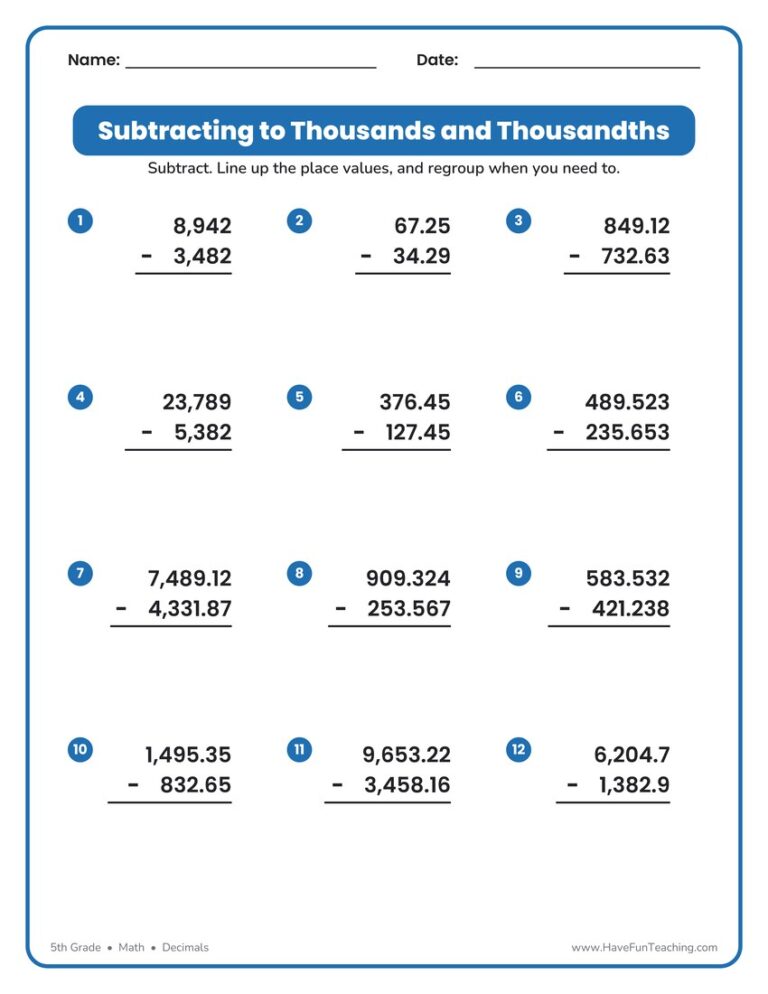
This Subtracting Thousands Thousandths Worksheet gives 5th grade students twelve problems subtracting whole numbers and decimals to the thousandths. Includes an answer key for quick, no-prep decimal practice.
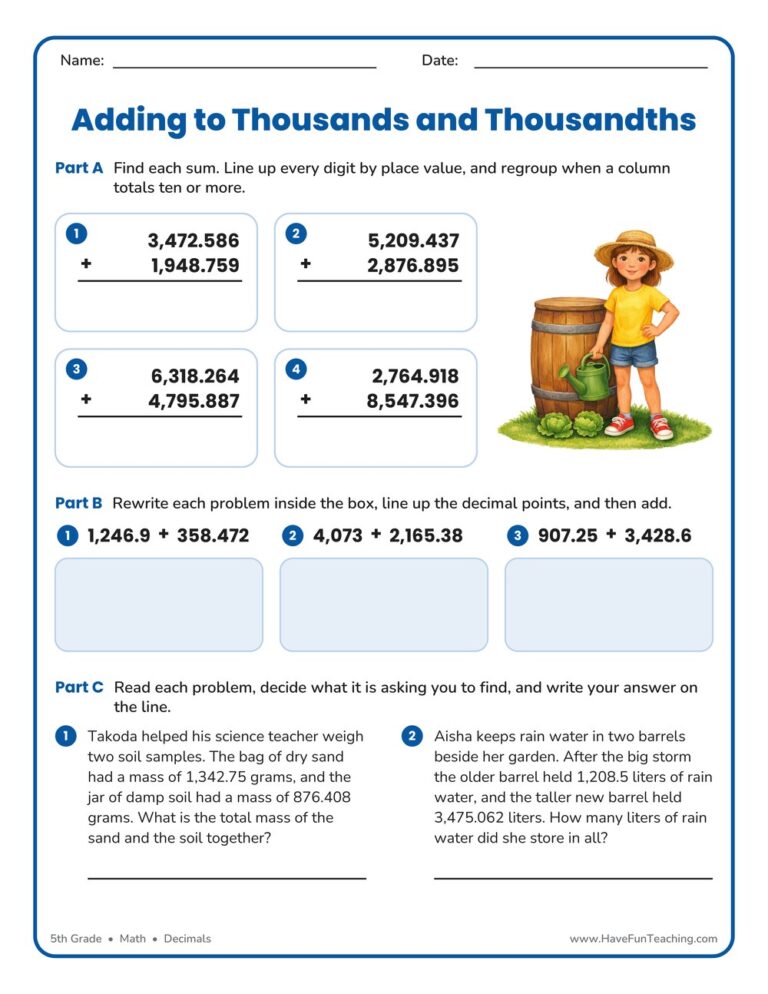
An add thousands thousandths worksheet for 5th grade, with stacked column problems, rewrite-and-align practice, and two measurement word problems. Answer key included, so decimal place value practice is ready to print.

Students turn six fractions into decimals and solve three word problems on this converting fractions to decimals worksheet, built for 5th grade. An answer key is included, so checking work takes seconds.
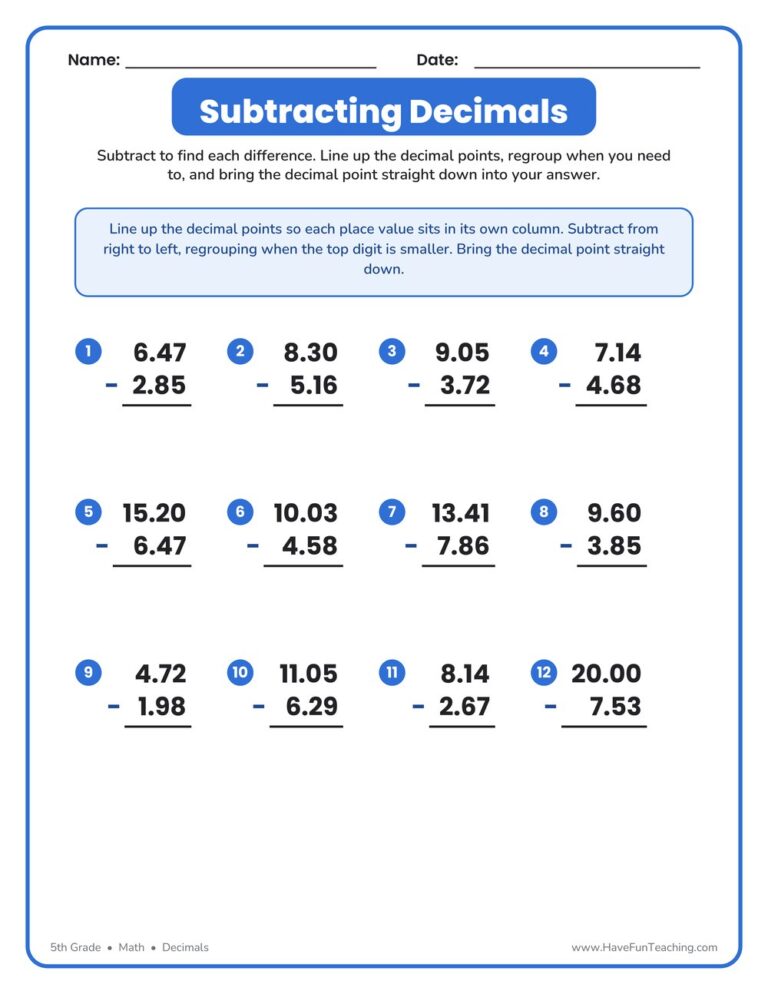
This subtracting decimals worksheet gives 5th graders twelve column subtraction problems that build place-value alignment and regrouping. Includes an answer key for quick, no-prep decimal practice at home or school.
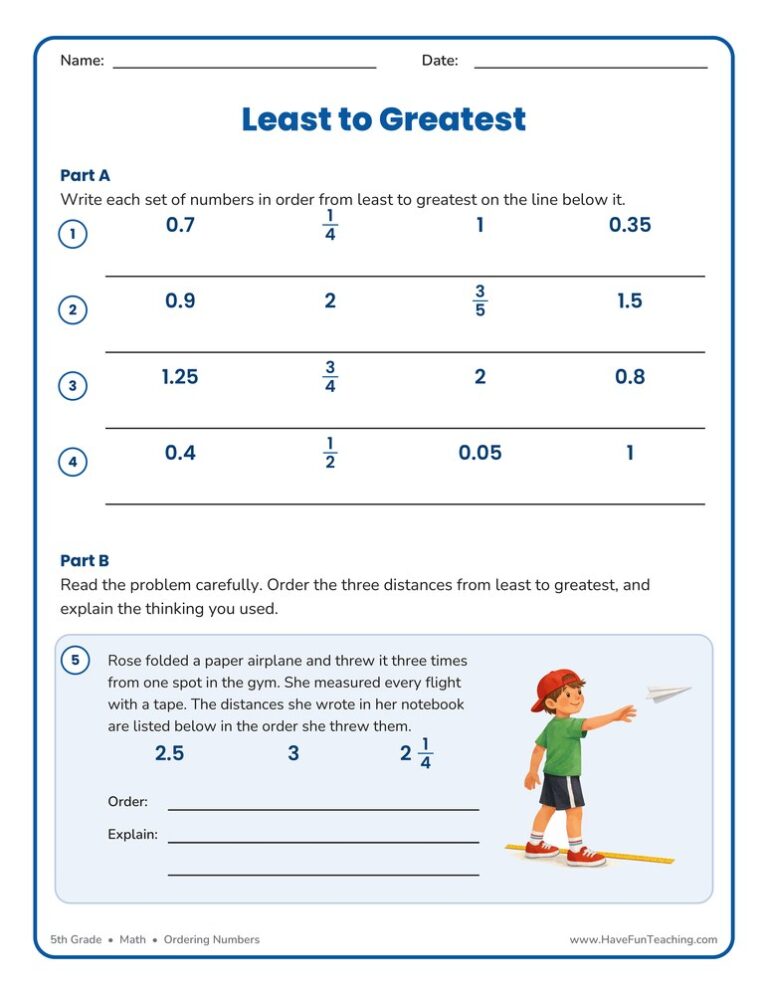
This Ordering Fractions, Decimals, and Whole Numbers Worksheet gives 5th graders four mixed-form sets plus a measurement problem to explain, with an answer key included, so comparing across forms finally clicks.
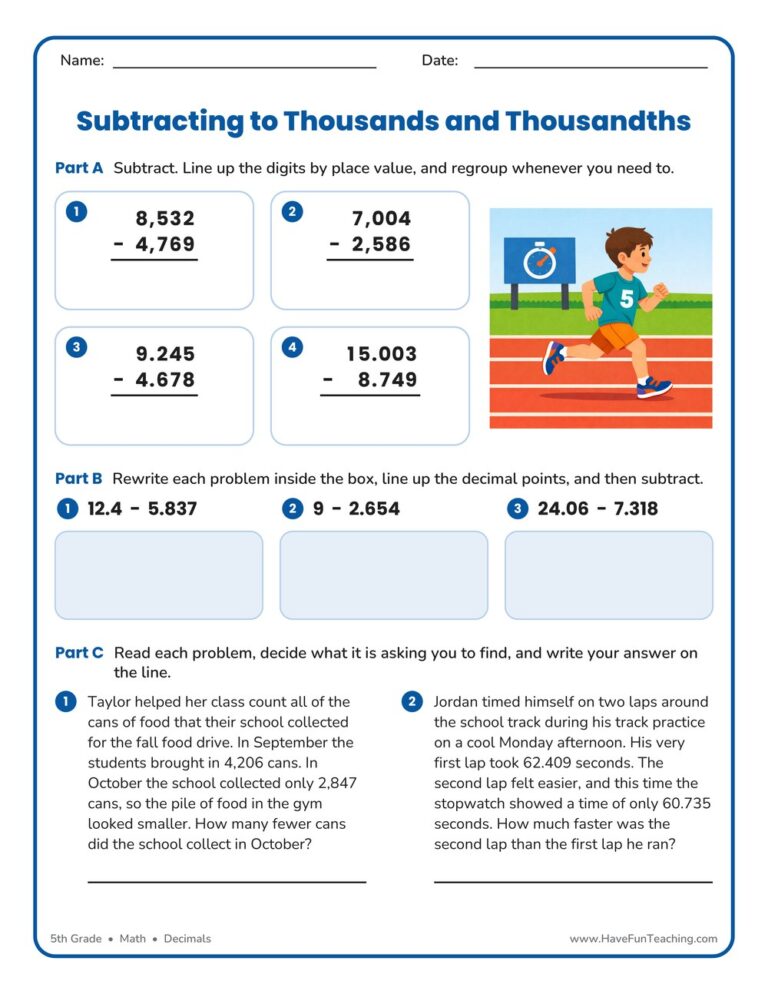
A 5th grade subtracting to thousands and thousandths worksheet with column practice, rewrite-and-align decimal problems, and two word problems. Answer key included, so students can check their own place-value work.
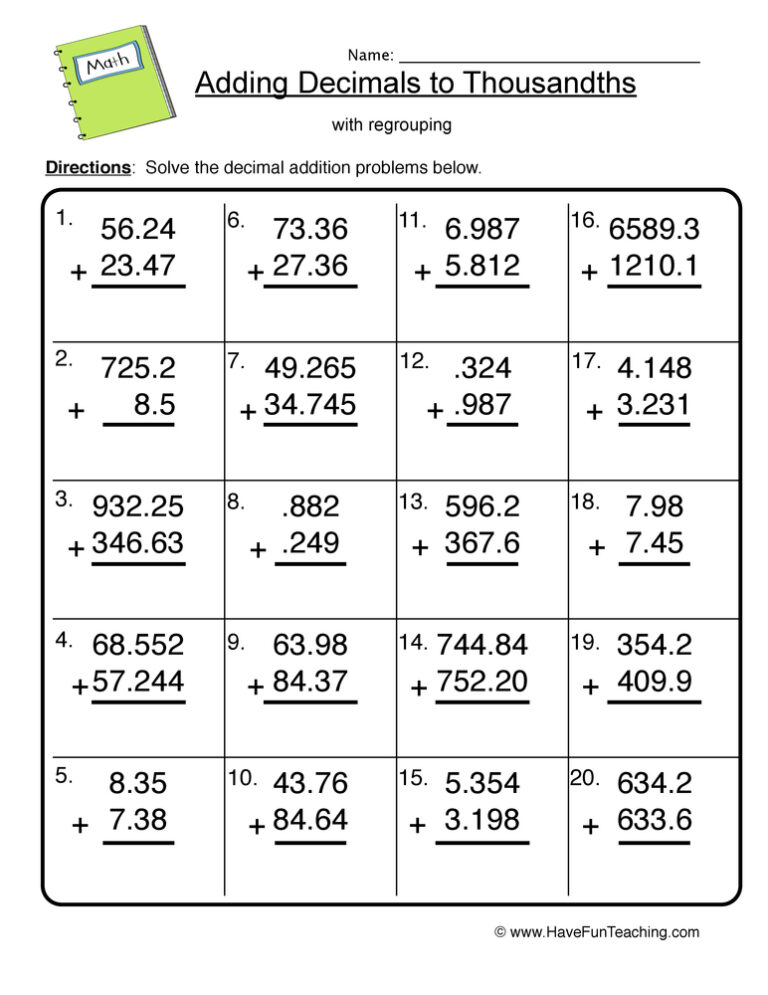
This Add Thousandths Decimal Worksheet gives 5th graders six stacked decimal sums plus three word problems, with an answer key included, so place value practice takes no prep at all.

This convert mixed numbers to decimals worksheet gives 5th Grade students six conversions and two word problems, with an answer key included, so they build real fluency with division and place value.

An adding decimals equations worksheet for 5th grade, with six column-form sums, three problems to rewrite in column form, and a hiking word problem. Answer key included, so students can check their own decimal alignment.
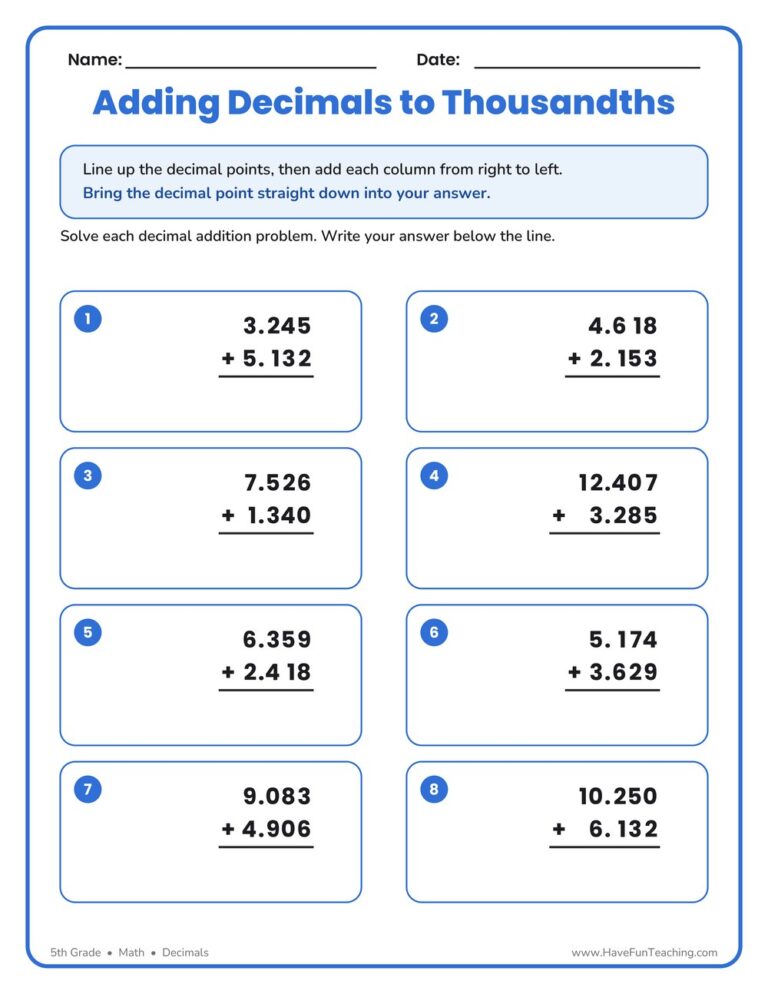
This adding thousandths decimal worksheet gives 5th graders eight column-addition problems to solve by lining up the decimal points. Includes a complete answer key for fast, no-prep decimal practice.

Students rename fractions and decimals as percents, read two shaded grid models, and solve two real-world problems on this Making Percentages Worksheet. Built for 5th grade with an answer key included, so practice stays quick and low-prep.




Reviews
There are no reviews yet