
3 days free
Ready for the whole library?
You’ve had your freebie — but members download 10,000+ resources for every grade, all year long. Try it free — $0 today, cancel anytime.
Free for teachers
Pick your grade. We’ll send 10 free resources.
Worksheets, activities and a video — picked for your classroom, ready to print tonight.
One free bundle per teacher. We’ll also send free teaching ideas each week — unsubscribe anytime.


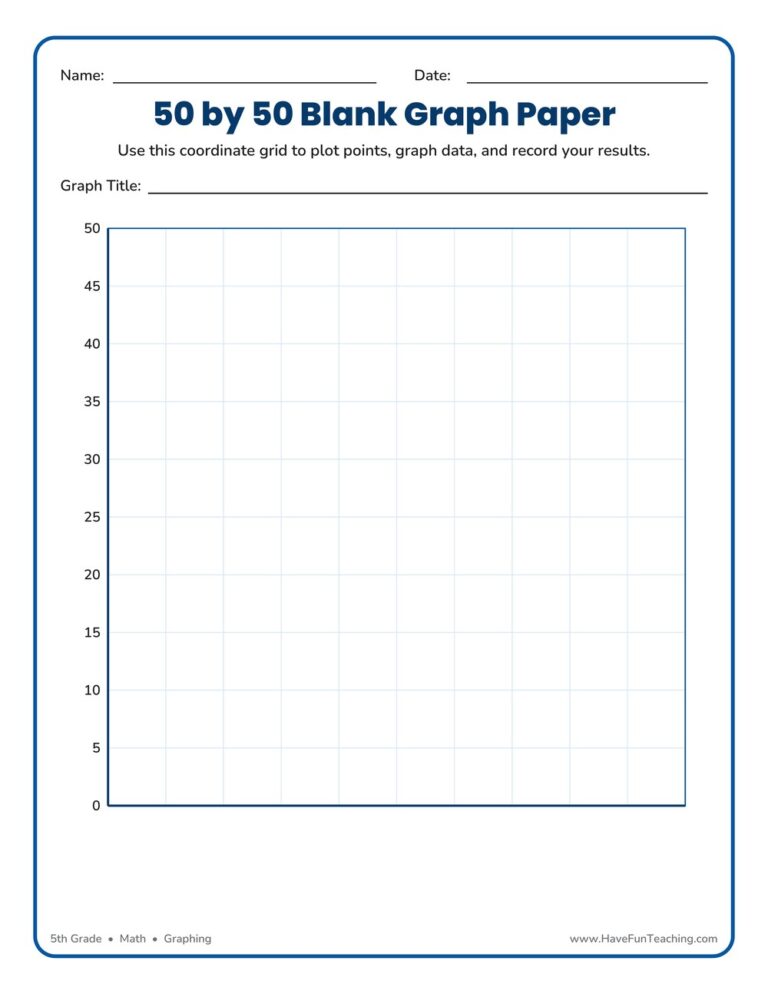
This 50 by 50 blank graph paper gives 5th grade math students a clean, pre-numbered coordinate grid (0 to 50 by fives) for plotting points and graphing data. Two ready-to-print grid pages make neat, accurate graphs simple at home or school.
This 30 by 30 blank graph paper gives 5th graders a large, reusable grid for graphing and plotting points. Print it for coordinate plotting, bar graphs, geometry, and everyday math practice.
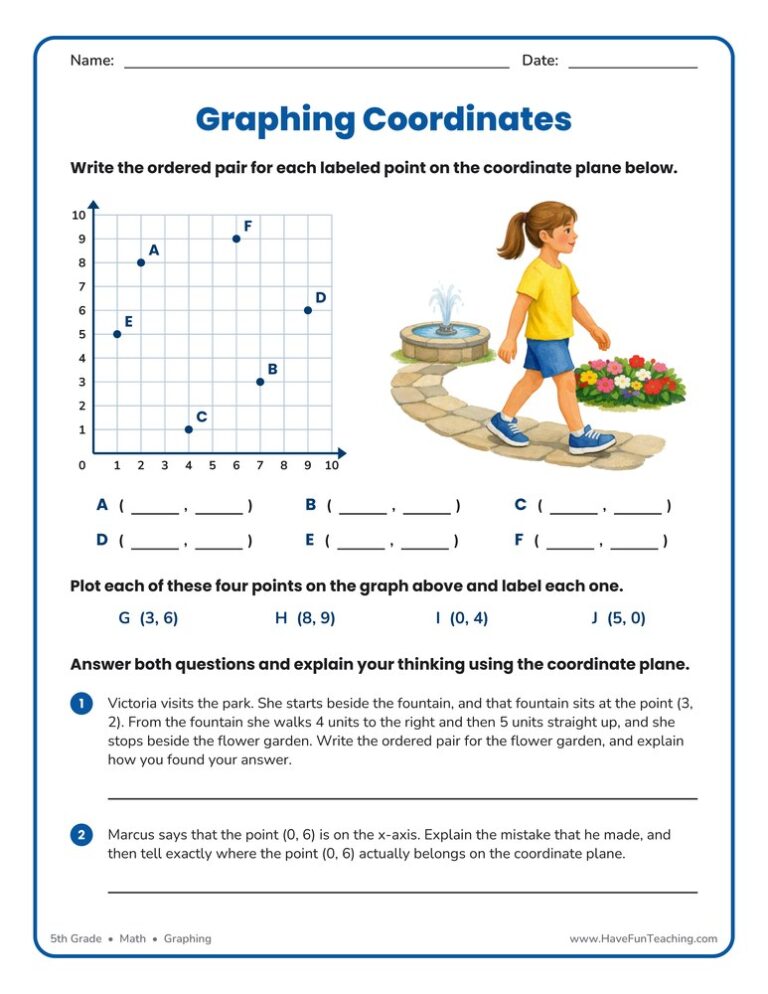
This Plotting Graphing Coordinates Worksheet gives 5th Grade students practice naming and plotting points on a coordinate plane. An answer key is included, so children can check their own work and build confidence fast.
Use this blank coordinate grid to help 5th Grade students plot ordered pairs on a first-quadrant coordinate plane. A reusable graphing template for lessons, warm-ups, and math centers.

A garden-themed Find Coordinate Pairs Worksheet where 5th graders write ordered pairs for plotted points, then plot and connect four corners to find a perimeter. Answer key included for fast, no-prep graphing practice.
This 1000 by 1000 blank graph paper gives 5th grade students a first-quadrant grid with both axes numbered to 1000, plus title and label lines, so any data set is easy to plot.
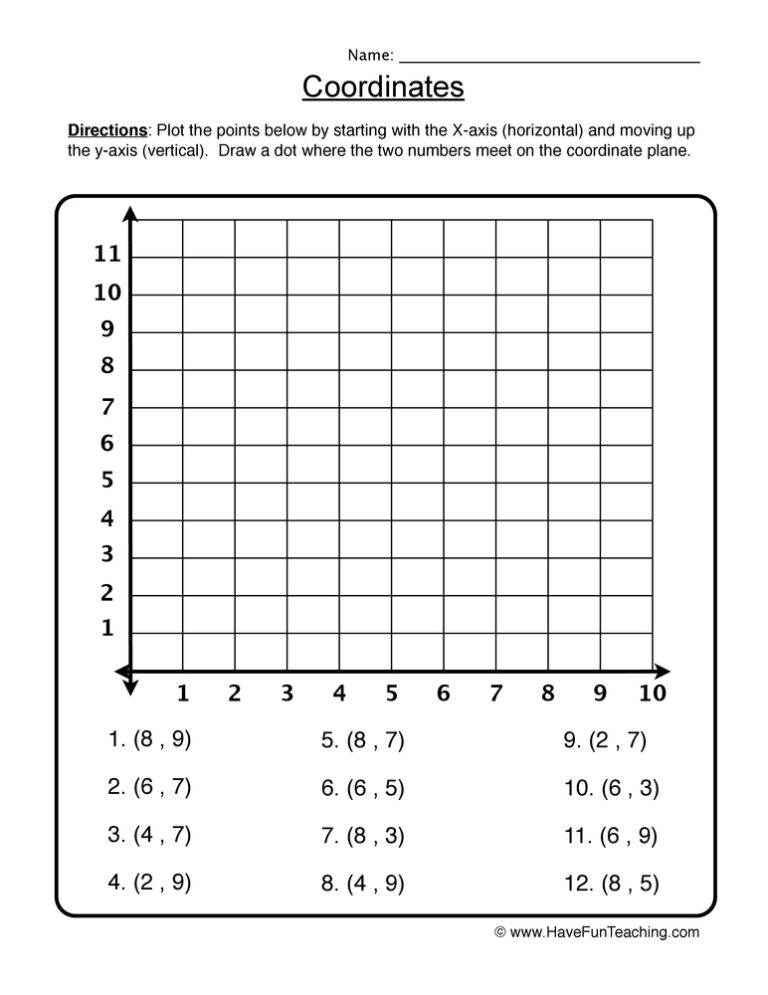
This Use Coordinate Pairs Worksheet asks 5th graders to name four plotted points, plot four more ordered pairs on the same grid, and explain their thinking. An answer key is included for fast, no-prep graphing practice.

This 500 by 500 blank graph paper worksheet gives 5th grade students a first quadrant grid numbered by fifties, with title and axis label rules, so they can plot and graph their own data with confidence.
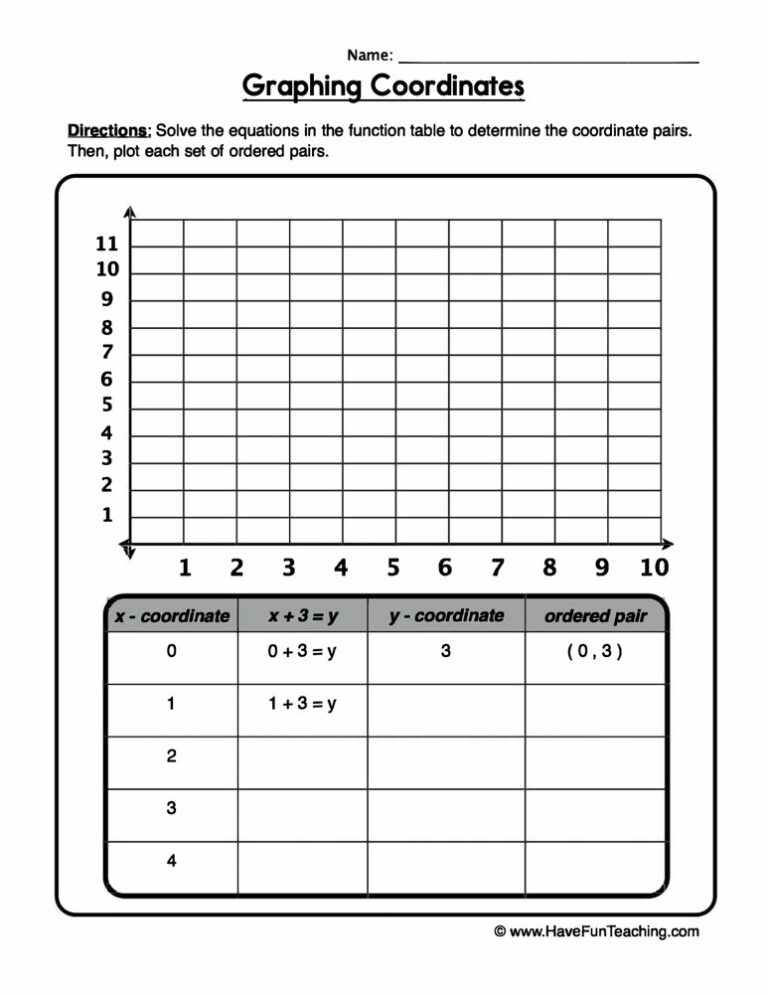
This Graphing Coordinates Equations Worksheet has 5th graders solve a function table, plot the ordered pairs on a grid, and explain the pattern. Answer key included for fast, no-prep coordinate practice.
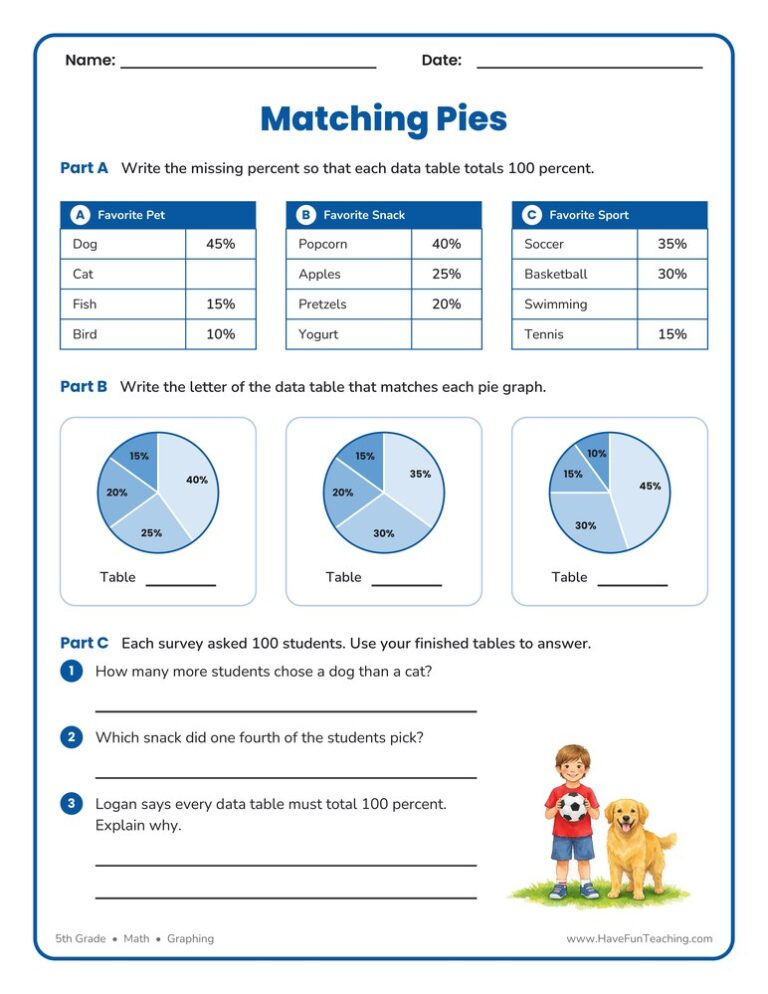
This Matching Pie Graphs Worksheet has 5th Grade students complete three data tables, match each table to its pie graph, and answer three questions. An answer key is included, so practice with circle graphs is easy to check.
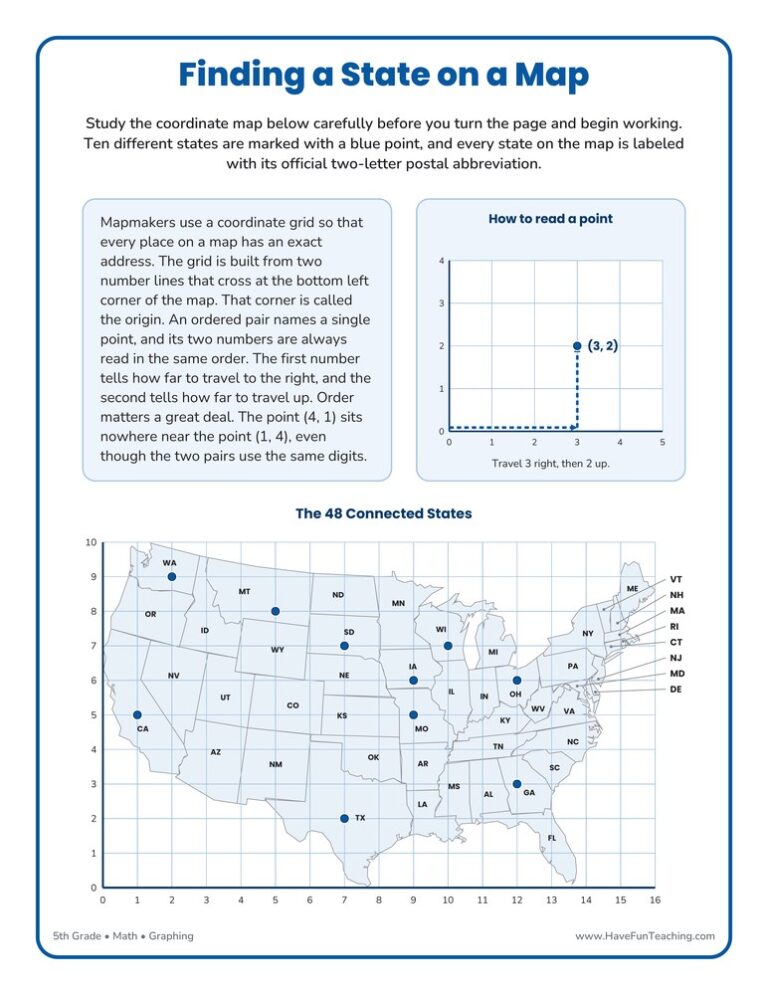
This Finding a State on a Map Worksheet gives 5th grade students a coordinate grid drawn over a United States map, plus a full answer key, so ordered pairs finally point at real places.

Using this Graphing Measurements Worksheet, students measure the objects below to create a line graph that shows growth over time.

This Decimals Bar Graphs Worksheet asks 5th Grade students to add and subtract decimals to hundredths, then shade a bar to each answer on a 0.00 to 1.00 scale. An answer key is included.

This Pie Graphing Pies Worksheet asks 5th graders to read a bakery circle graph, find the percent for each cookie, and shade their own graph. An answer key is included, so checking the work takes seconds.
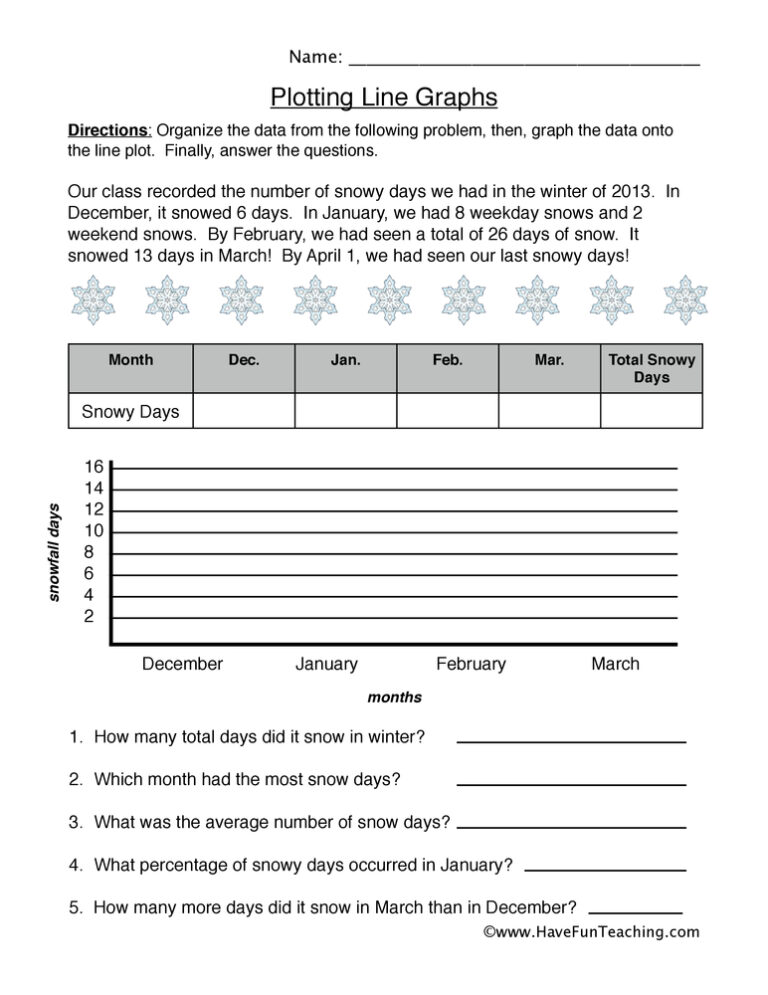
Using this Plotting Line Graph Worksheet, students analyze the number of snowy days in a line graph.
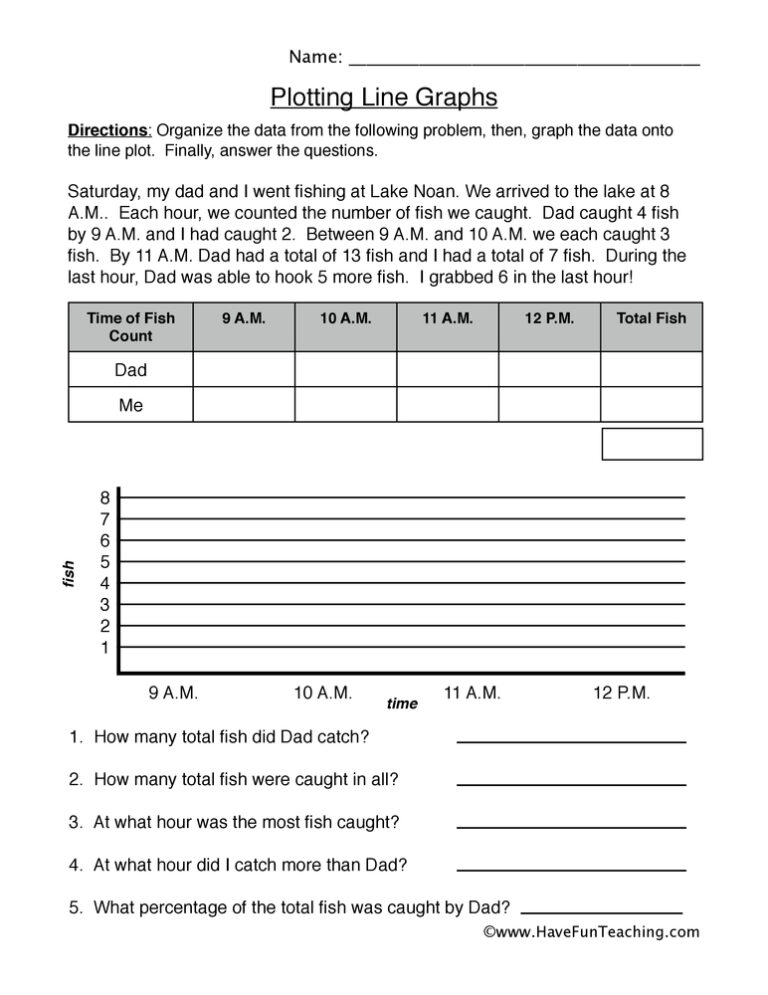
Using this Plotting Line Graphs Worksheet, students analyze the number of fish caught in a line graph.

Using this Graphing School Objects Worksheet, students count the number of objects in their own classroom and then record it on a bar graph.

Using this Organizing Measurements Worksheet, students organize the measurements listed below into a line plot by using an X to mark the data.

This plotting measurement data worksheet has 5th graders plot seashell lengths in eighths of an inch and solve fraction problems from the line plot. An answer key is included for quick checking.

Using this Organizing Measurement Data Worksheet, students organize the measurements listed below into a line plot by using an X to mark the data.



