

Money Graphing Worksheet
This Money Graphing Worksheet asks 4th graders to add dollars and cents, total each student’s fundraising, and graph the results on a scaled bar graph. An answer key is included, so checking accurate work takes seconds.
$6.97
Or free with a membership — members pay $3.33/mo for all 10,000+ resources. See plans
Want this one free?
Tell us where to send it and it’s yours — no card, no catch.
One free resource per teacher. We’ll also send free teaching ideas each week — unsubscribe anytime.
Teaching is easier with a membership
Unlimited printables, games & videos for PreK–6th — for your classroom or homeschool. Cancel anytime.
Start your 3-day free trial$0 today · cancel anytime · Instant access to 10,000+ resources
About this resource
Description
This Money Graphing Worksheet gives 4th graders a real reason to add money and then show what the numbers mean. Students start with a small set of money amounts, add them carefully to find a total, and then turn each total into a bar on a scaled graph. Adding money with dollars and cents is a skill children use long before they use it on a test, and pairing it with a bar graph turns a column of numbers into a picture a child can read at a glance. This Money Graphing Worksheet keeps both halves of that skill on one page, so students practice careful decimal addition and accurate graphing in a single, connected task.
The worksheet opens with a data table showing four students and the money each one raised over three weeks at a school garden sale. Students add across each row and write the total in the last column, which makes this a genuine 4th grade addition worksheet as well as a graphing activity. Next, they use those totals to draw a bar for every student on a graph scaled in five dollar steps. Two closing questions ask students to compare the highest and lowest amounts and to work out how much more the group needs to reach a class goal, so the sheet finishes with the kind of multi step thinking fourth graders are expected to show. Use it for morning work, small group practice, a homework page, or an early finisher activity.
What’s Included
- 1 print-ready PDF worksheet
- Answer key
- 4 money addition rows, a 4-bar scaled graph to complete, and 2 multi-step questions
Three things make this page work for growing mathematicians. First, every total lands on a labeled gridline, so a child gets immediate feedback: if the bar does not reach a line, the addition needs another look. Second, the money amounts use dollars and cents, which keeps decimal place value in front of students instead of letting them treat money as whole numbers. Third, the closing questions require students to reason with the graph rather than simply read it, comparing two values and then working backward from a goal. Together those features move students past copying numbers and toward explaining what the data shows.
Teachers and parents can stretch this skill in easy ways. Have students collect their own data for a week, such as minutes read or coins saved, and graph the weekly totals the same way. Give a small handful of play money and ask children to build an amount that matches a bar on the graph. Turn the questions around by naming a total and asking which two weeks could have produced it. You can also print the sheet twice and let partners compare answers before checking the key together, which turns the graph into a conversation about accuracy.
Related Resources
What teachers say
Reviews
You must be logged in to post a review.
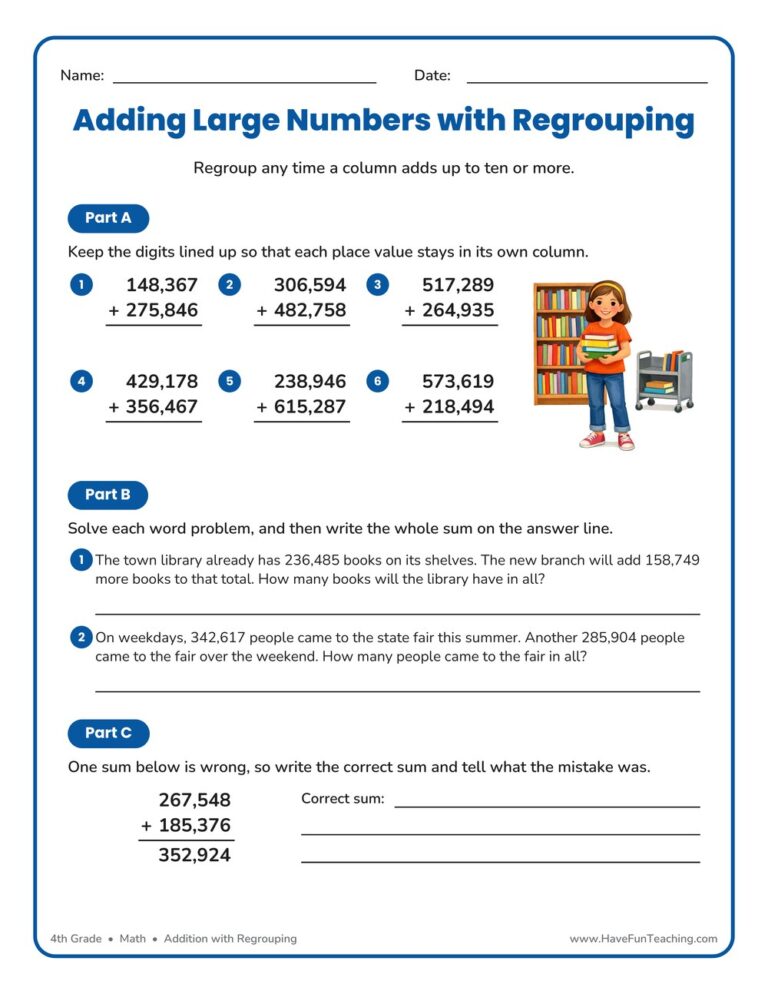
This Add Hundred Thousands Regrouping Worksheet gives 4th graders six-digit column addition, two real-world word problems, and an error-analysis task. Answer key included, so you get no-prep practice that builds real accuracy.

Adding Hundred Thousands No Regrouping Worksheet gives 4th grade students six stacked six-digit problems and three word problems, with an answer key included, so place value practice stays quick and accurate.
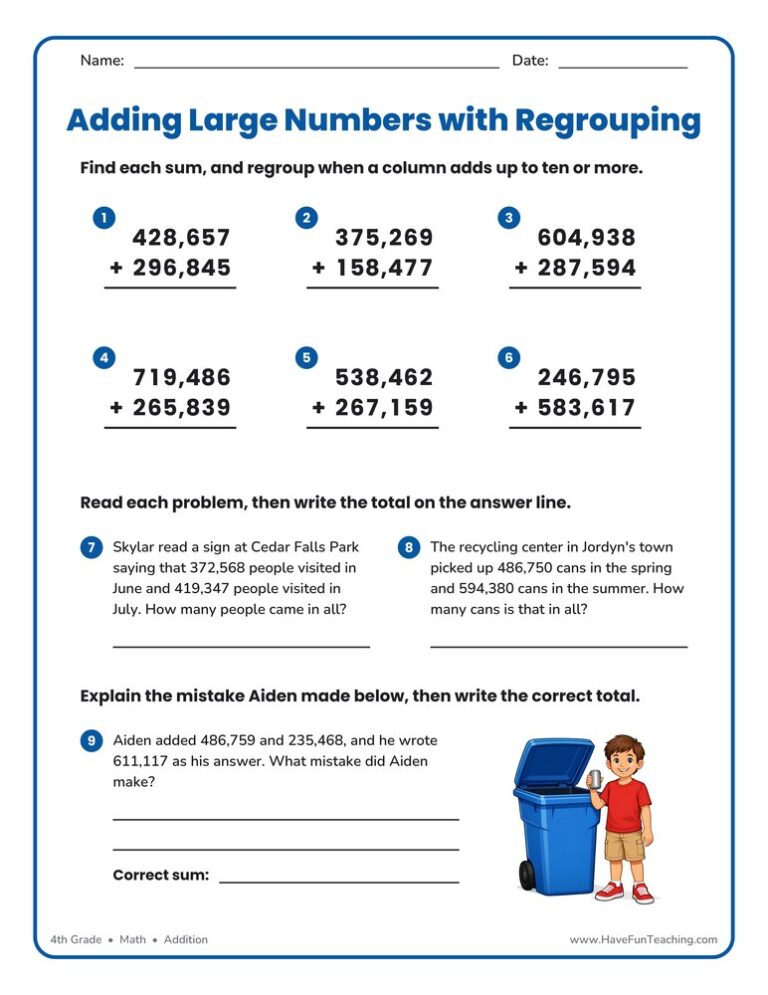
This adding hundred thousands regrouping worksheet gives 4th graders six-digit column addition, two word problems, and an error-analysis question, with an answer key included so practice checks itself in minutes.
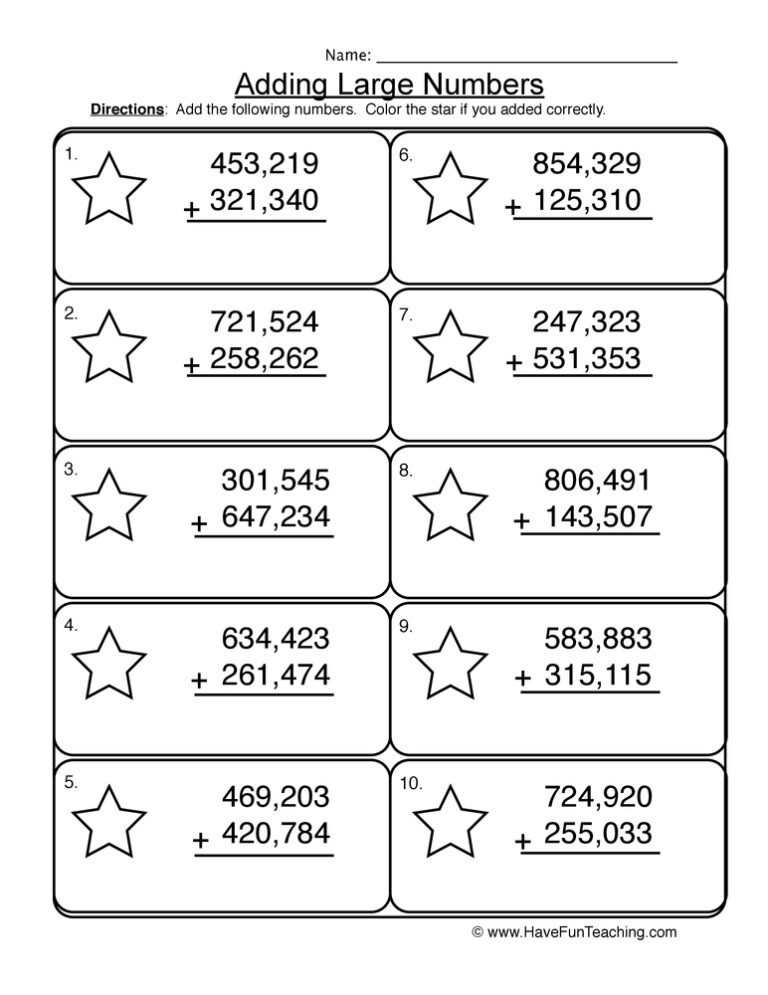
The Add Hundred Thousands No Regrouping Worksheet gives 4th grade students six-digit column addition, two word problems, and an answer key, so lining up place value becomes automatic.

This Three Addends to Thousand Addition Word Problems Worksheet gives 4th grade students three story problems, a work box for each, and a written explanation task, with a full answer key included.

In this Movie Math Add and Subtract Multi-Digit Numbers Activity, students add and subtract multi-digit whole numbers.
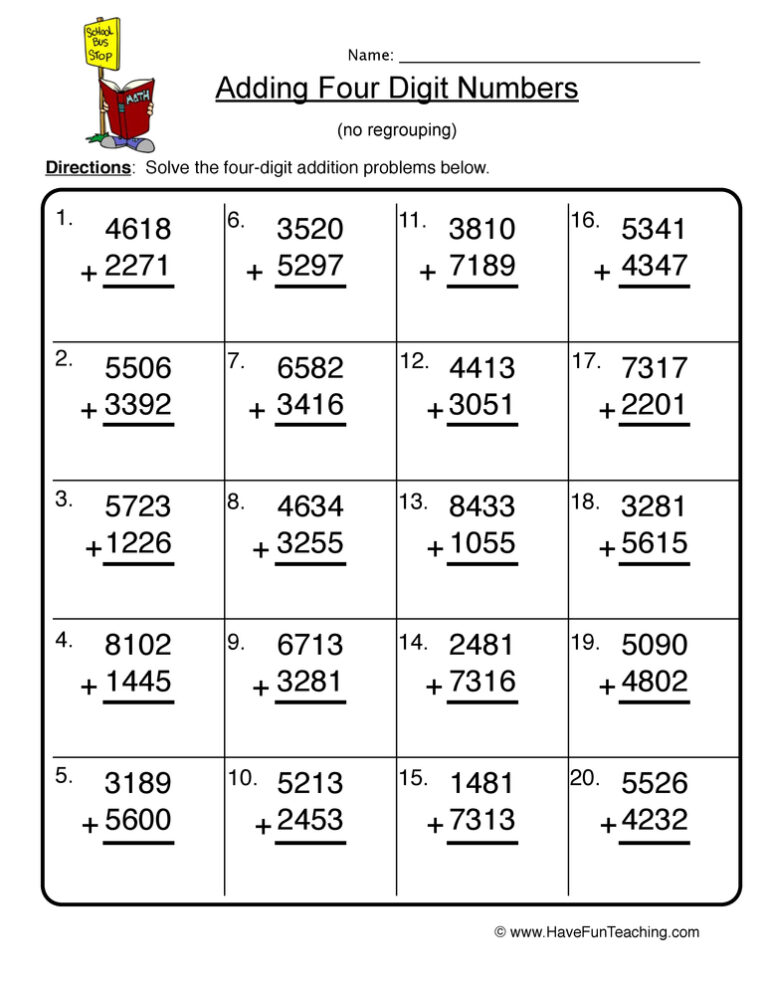
This quad digit addition worksheet has 4th grade students add four-digit numbers without regrouping, then solve three word problems. An answer key is included to make checking fast.

In this 4.NBT.4 Fourth Grade Common Core Lesson, students add and subtract multi-digit whole numbers.

Using this Frosting and Fractions Activity, students use the fraction bars to solve kitchen conundrums.
In this Adding and Subtracting to 1000 Activity, students add and subtract within 1000, using concrete models or drawings and strategies.

Using Subtracting with Measures Worksheet, students solve real life word problems involving different types of measurements.

In this 4.NF.5 Fourth Grade Common Core Lesson, students express a fraction with denominator 10 as an equivalent fraction with denominator 100, and thenadd two fractions.




Reviews
There are no reviews yet