

Organizing Data Using a Bar Graph Worksheet
This organizing data using a bar graph worksheet has 3rd Grade students turn a data table into a scaled bar graph, then answer read, compare and two-step questions. An answer key is included.
$6.97
Or free with a membership — members pay $3.33/mo for all 10,000+ resources. See plans
Want this one free?
Tell us where to send it and it’s yours — no card, no catch.
One free resource per teacher. We’ll also send free teaching ideas each week — unsubscribe anytime.
Teaching is easier with a membership
Unlimited printables, games & videos for PreK–6th — for your classroom or homeschool. Cancel anytime.
Start your 3-day free trial$0 today · cancel anytime · Instant access to 10,000+ resources
About this resource
Description
This organizing data using a bar graph worksheet hands third graders a table of real data and asks them to turn it into a scaled bar graph, then read their own graph to answer questions. A class food drive collected cans of soup, beans, rice, pasta and corn, and the counts are given in a table. The graph’s squares are worth five cans each, so a student cannot copy a number straight across; every bar has to be divided by the scale first. That single step is what separates third grade graphing from the one-to-one picture graphs of first and second grade.
Part A holds the data table and the empty axes, already labeled and gridded from 0 to 35 in fives. Part B asks four questions about the finished graph: a straight read, a comparison, a two-step comparison against two categories at once, and a written explanation of a classmate’s mistake. Have students draw all five bars before answering anything, then work down the questions and check each answer against the graph they drew. The answer key on the second page shows the completed graph and a model written answer, so this 3rd grade bar graph worksheet can be marked in a moment.
What’s Included
- A five-row data table listing the cans collected for each kind of food
- Labeled and gridded axes scaled in fives, ready for the student to draw five bars
- Two questions that read and compare single bars, plus one genuine two-step question
- A written-response item asking students to explain a scale mistake
- A full answer key with every bar drawn and a model written answer
Three Reasons This Helps Kids
- Drawing the bars, rather than reading a finished graph, is what teaches students what a scale actually means.
- The two-step question asks students to combine two categories before comparing, which is where third grade data problems usually break down.
- Explaining someone else’s mistake makes students say the rule out loud instead of just following it.
Ideas for Teachers and Parents
- Ask students to say the scale in words before they draw anything: one square stands for five cans.
- Have them count the axis aloud by fives, which is the same skip counting the bars depend on.
- Run a real tally in your own room, then use this organizing data using a bar graph worksheet as the model for graphing your class data on the back of the page.
- Use question four as a quick discussion: why does counting one square per can give a bar six times too tall?
Related Resources
What teachers say
Reviews
You must be logged in to post a review.
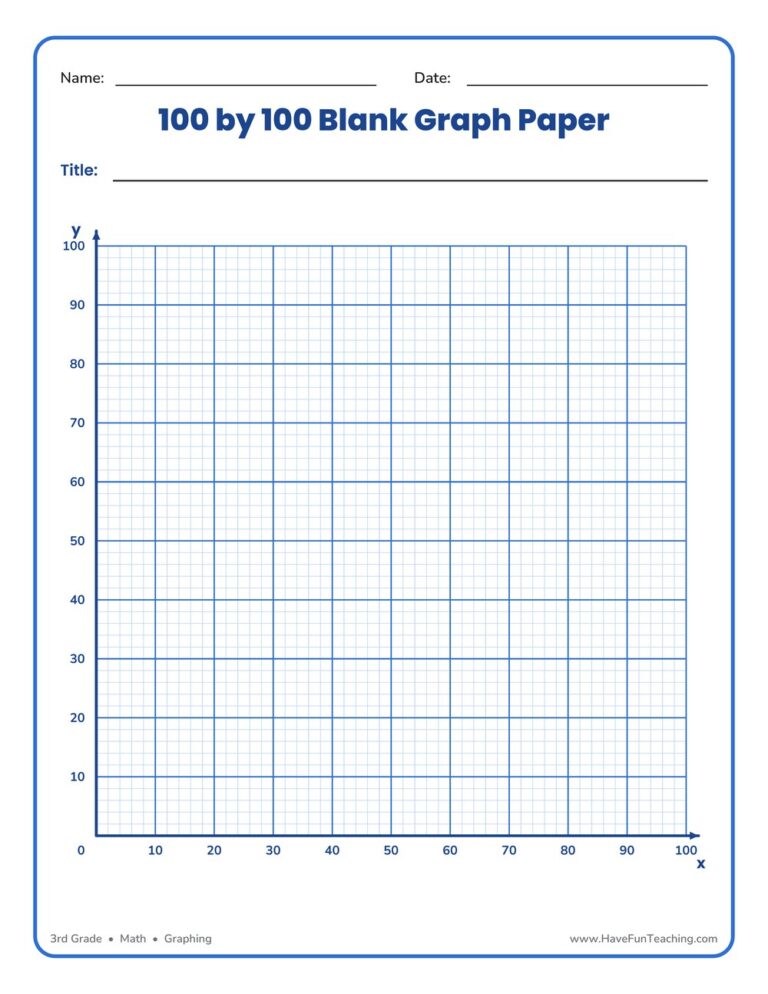
This 100 by 100 blank graph paper worksheet gives 3rd graders a ready-made coordinate grid numbered to 100 by tens — perfect for plotting points, building bar graphs, and organizing data with no prep required.
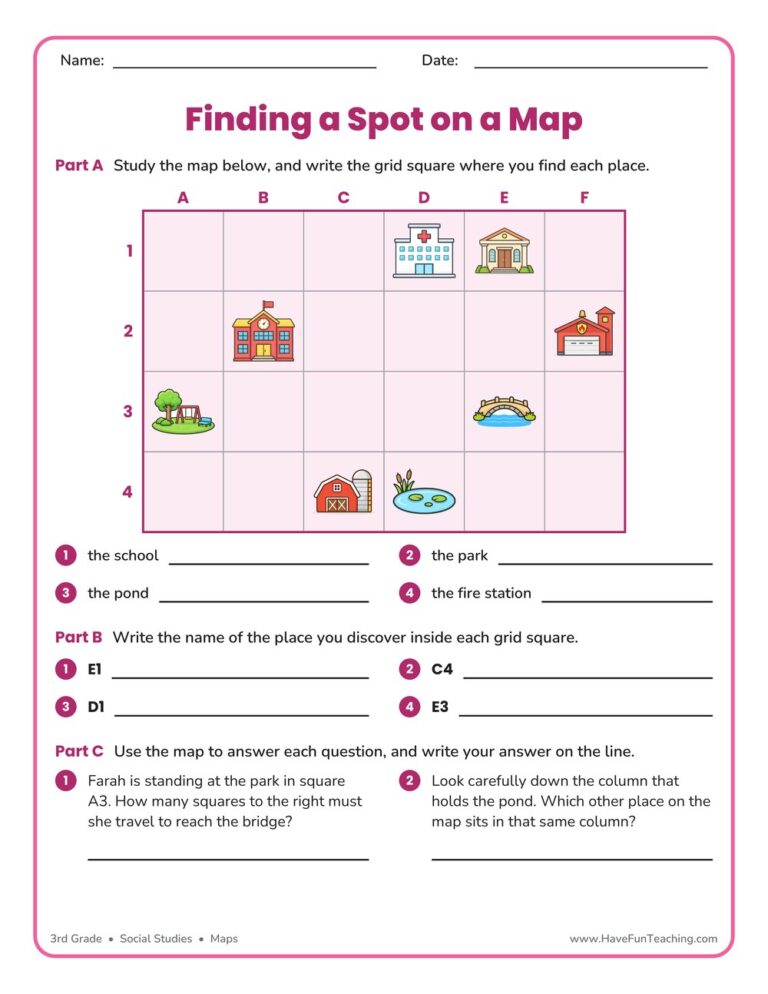
A finding a spot on a map worksheet for 3rd grade, built on one labeled town grid with place-to-square, square-to-place, and reasoning questions. Answer key included for quick no-prep map skills practice.

This making a graph using data worksheet has 3rd graders build a scaled bar graph from an orchard data table, then answer four questions about it. An answer key is included, so graphing practice needs no prep.

Students build a scaled bar graph from a class food survey in this Thanksgiving Graph Worksheet, then answer comparison questions about the data. Written for 3rd Grade, with an answer key included for fast checking.
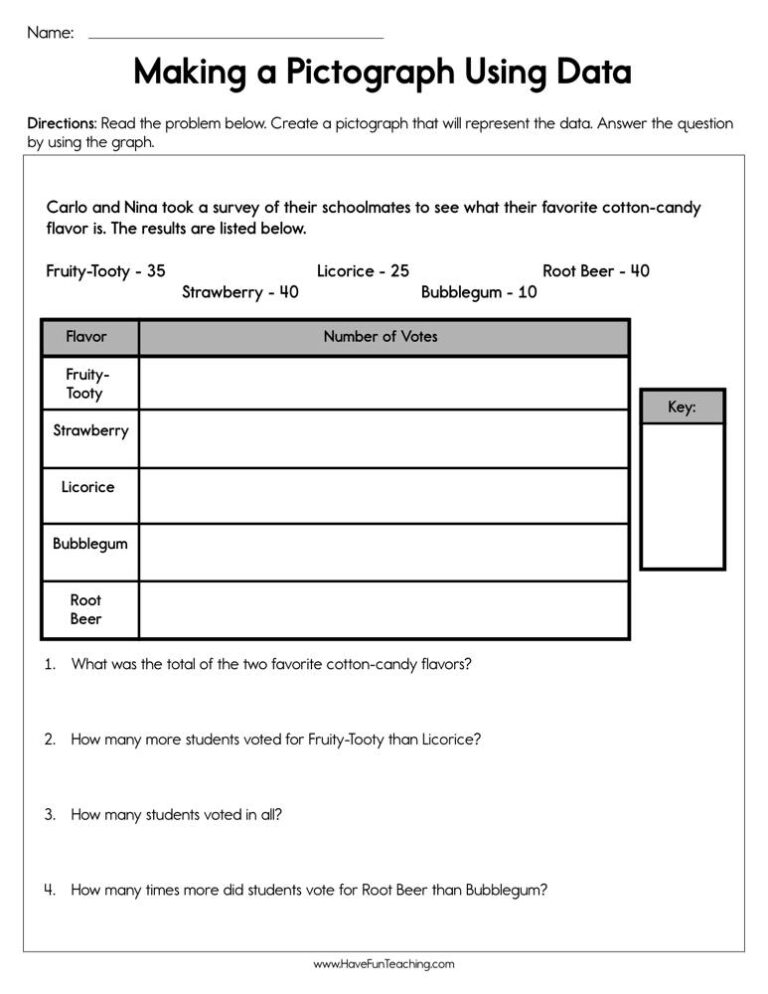
A Making a Pictograph Using Data Worksheet for 3rd Grade: students draw one star for every five votes, then read, compare, and explain their graph. Answer key included for easy, no-prep graphing practice.

This Multiplication Bar Graphs Worksheet has 3rd grade students solve six multiplication problems and graph each product on a scaled bar graph. An answer key is included, so checking work takes seconds.

A blank pie graph worksheet where 3rd graders collect their own data, color the circle sections, and label a key. A reusable, no-prep template for hands-on graphing practice at home or school.

Using this Graphing Measurements Worksheet, students measure the objects below to create a line graph that shows growth over time.
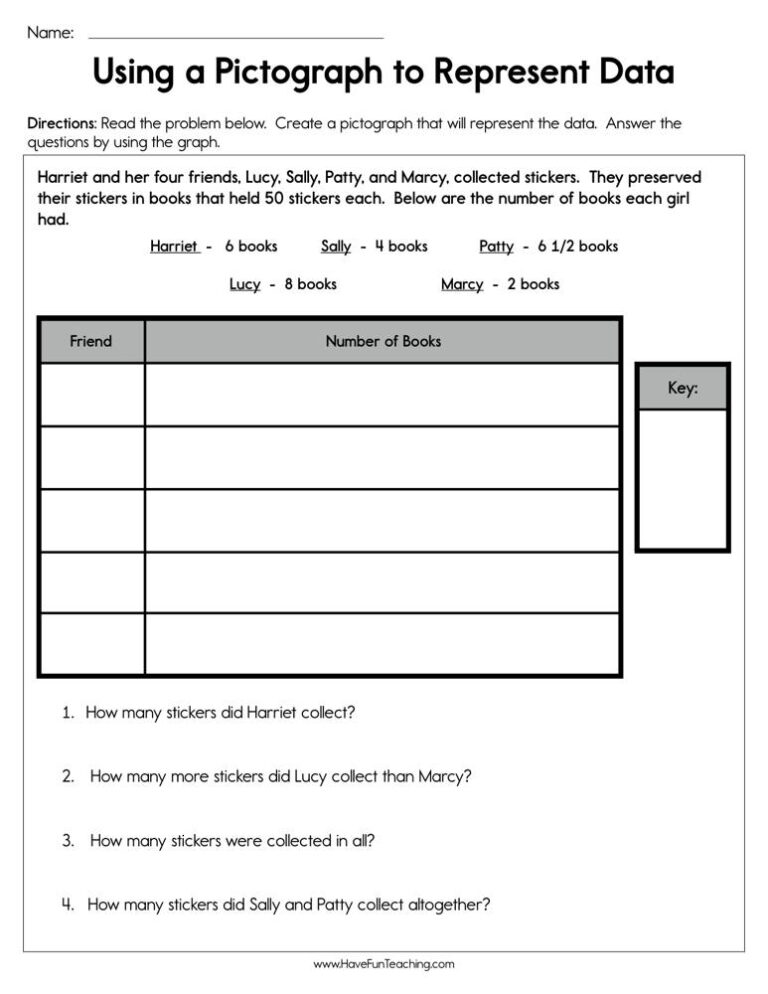
This using a pictograph to represent data worksheet has 3rd Grade students draw a scaled star graph, with half stars, from a sticker table. Answer key included for easy checking.

This graphing favorite foods worksheet has 3rd graders draw a scaled bar graph from lunch vote data, then answer comparison and two-step questions. An answer key is included for fast checking.
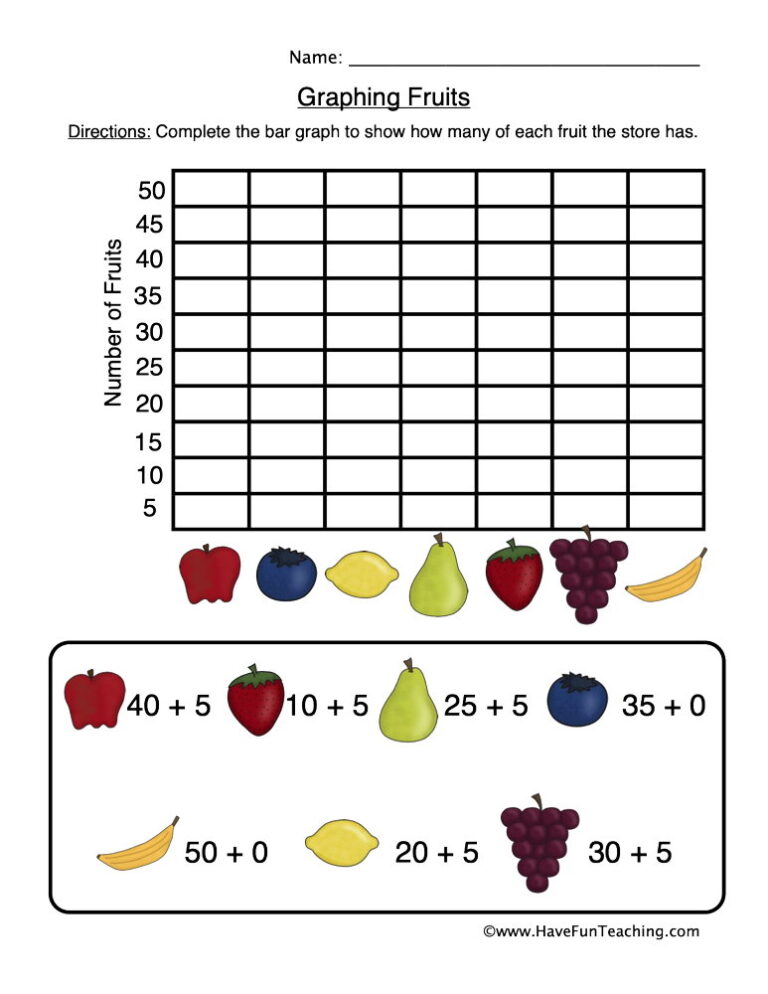
The Graphing Fruits Worksheet has 2nd grade students solve four addition facts, color a bar graph with their answers and read it to answer three questions, with a full answer key.
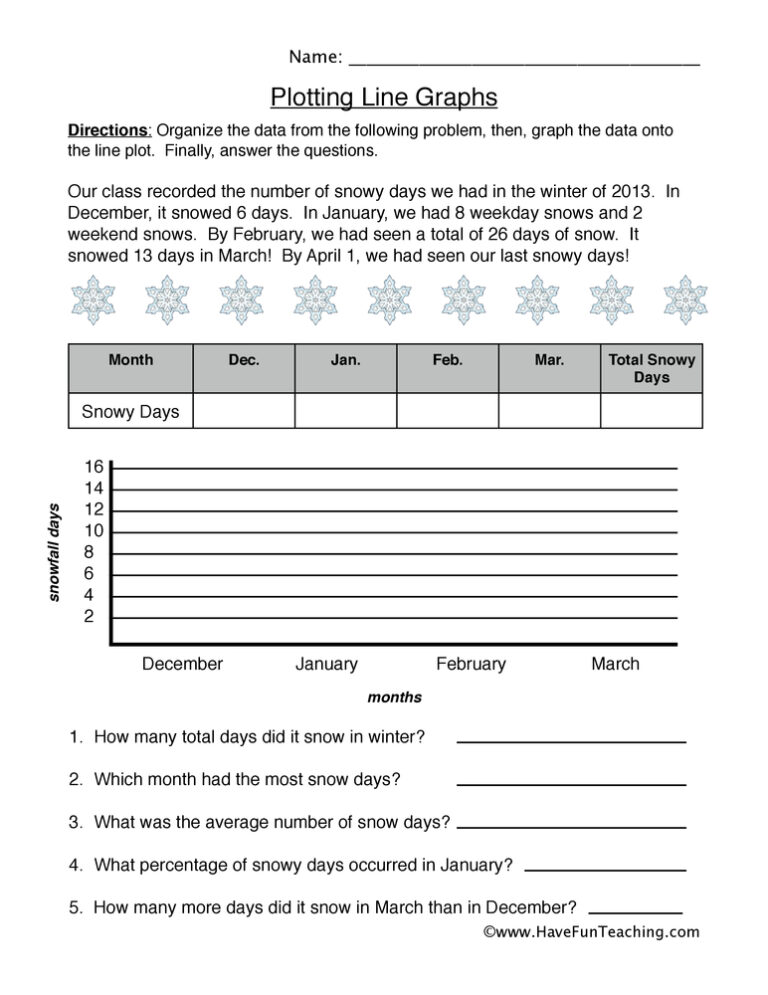
Using this Plotting Line Graph Worksheet, students analyze the number of snowy days in a line graph.




Reviews
There are no reviews yet