A hands-on bar graph activity for preschool through 1st grade: count ocean animals and insects, color the graphs, and play a spinner game. Answer key included.

This summer graphing activity has children spin, tally and color a bar graph. Made for Kindergarten to 2nd Grade, with a practice page and answer key included.
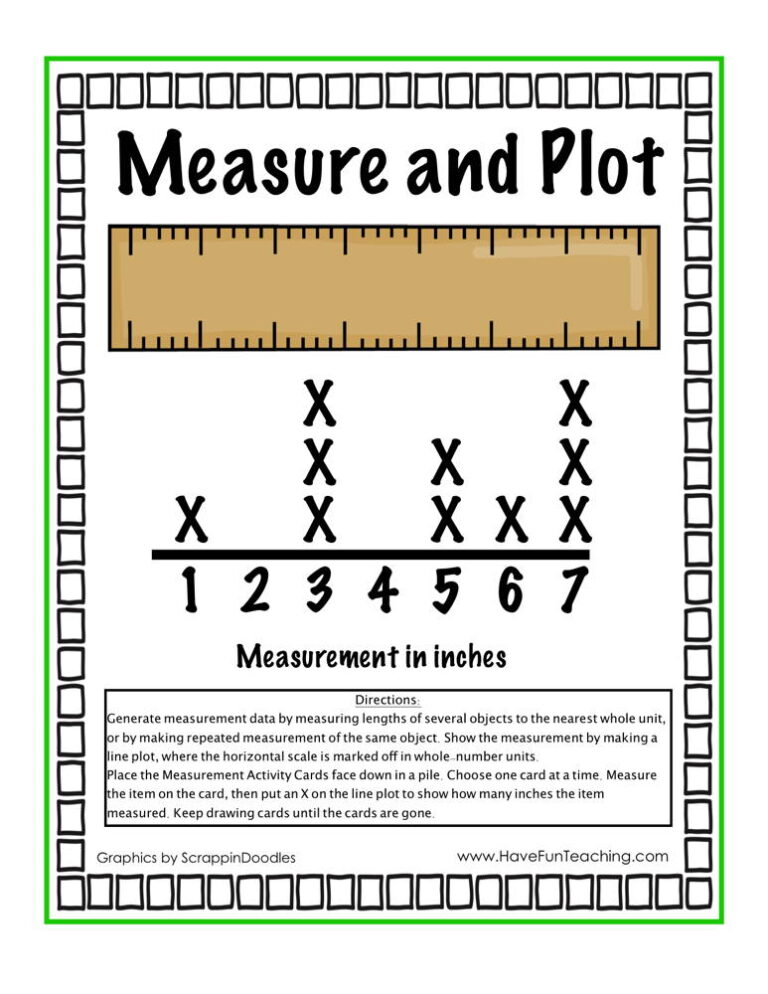
In this measure and plot data activity, 3rd to 5th grade students measure true-size objects to the nearest quarter inch and build a line plot. Answer key included.
Using this Plotting Measurements Activity, students organize the measurements listed below into a line plot by using an X to mark the data.
Using this Let's Get Graphing Activity, students solve one- and two-step “how many more” and “how many less” problems using information presented in scaled bar graphs.

Using this Sort Count Graph Activity, students count the amount of fruits and vegetables to record them on a graph.
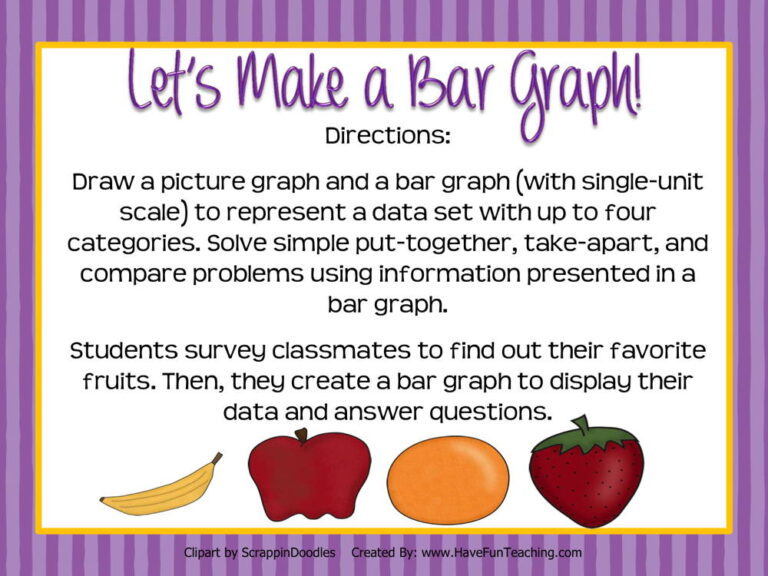
Using this Let's Make a Bar Graph Activity, students draw a picture graph and a bar graph to represent a data set with up to four categories to solve simple put-together, take-apart, and compare problems using information presented in a bar graph.