









Survey the class first
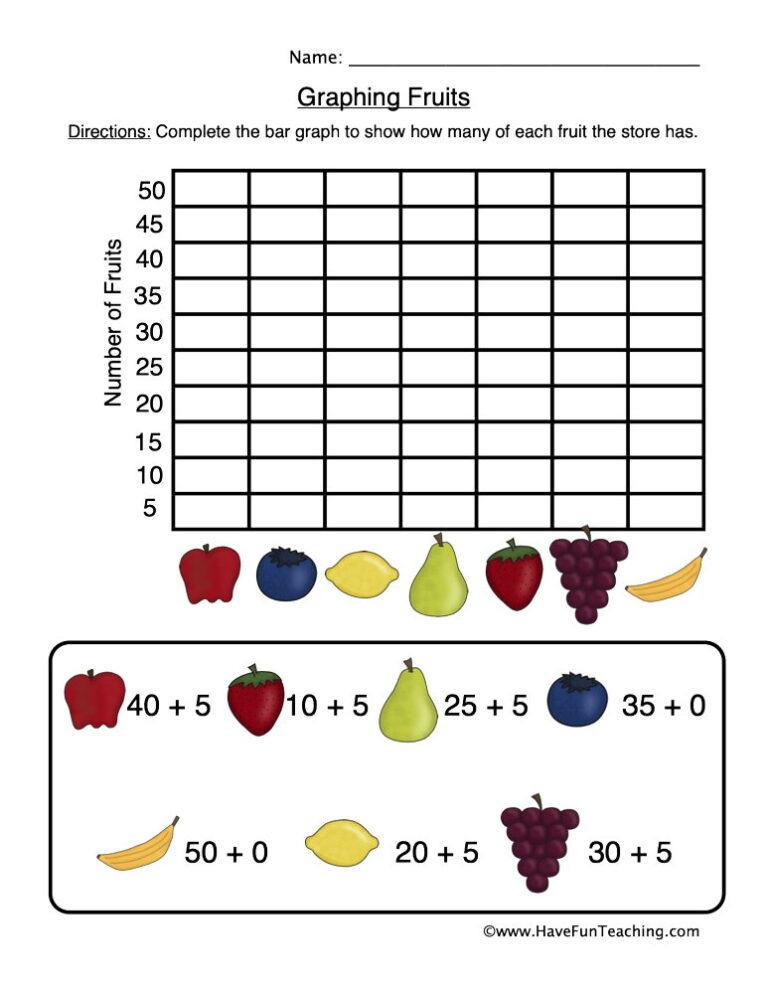
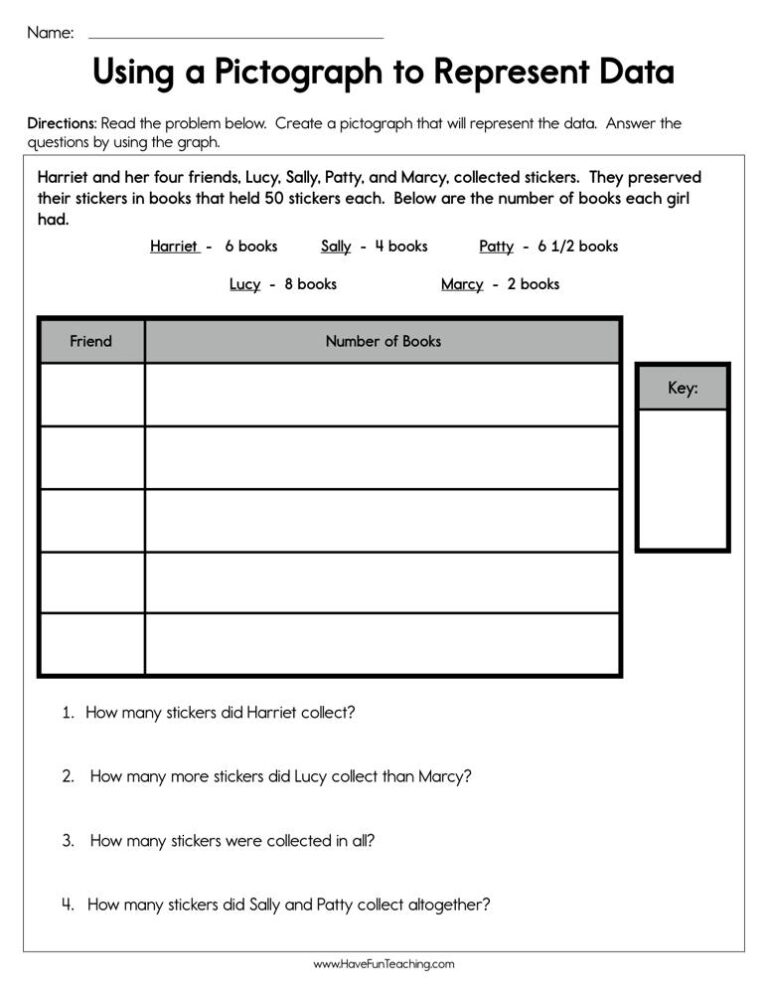
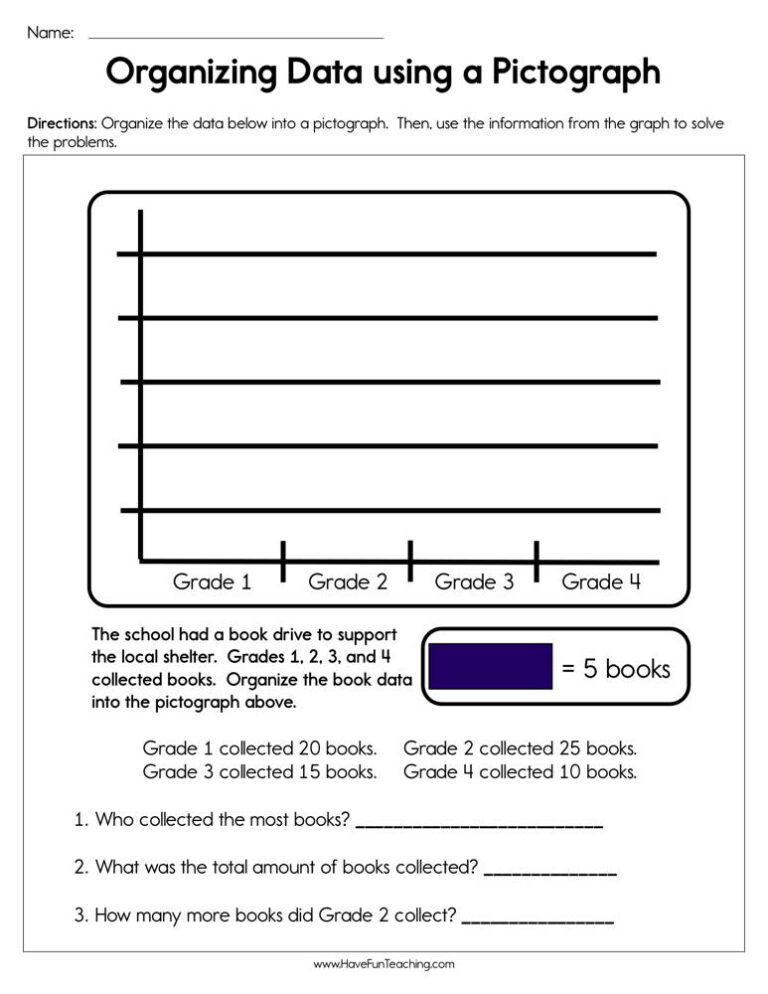
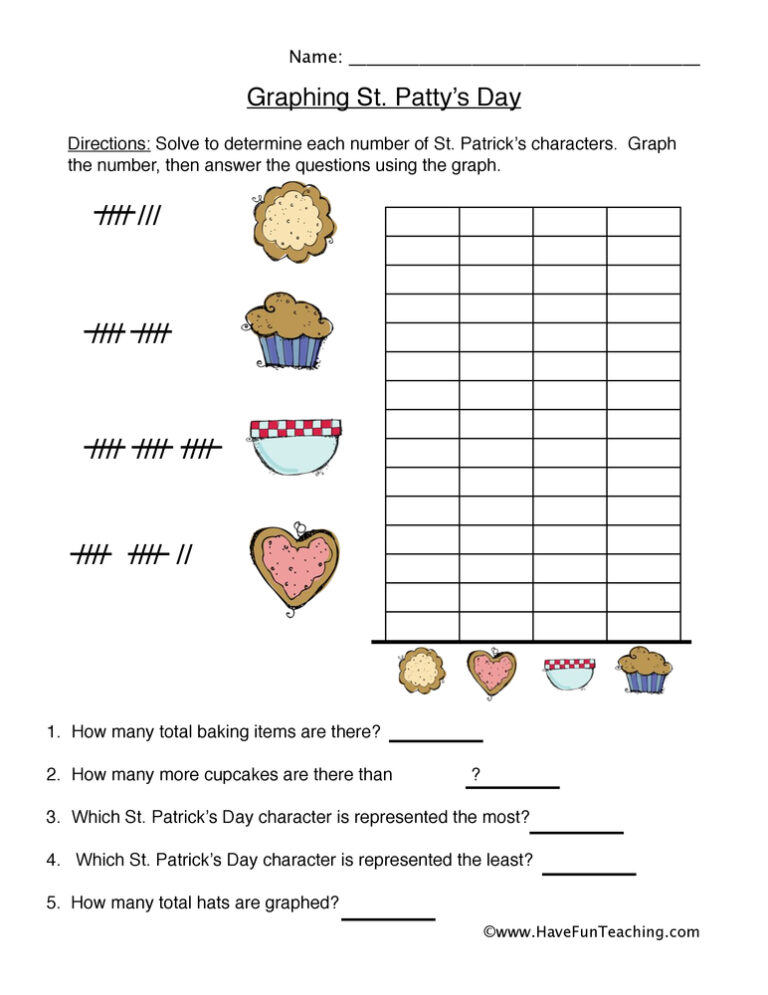
Let kids pick a question, like "What is your favorite recess game?", and collect tallies from the whole class. Then they turn the tallies into a bar graph with a scale of 2. Data they gathered themselves is data they actually care about reading.
Why it works: going from real objects to pictures to symbols is a core recommendation of the U.S. Department of Education's elementary math guide.
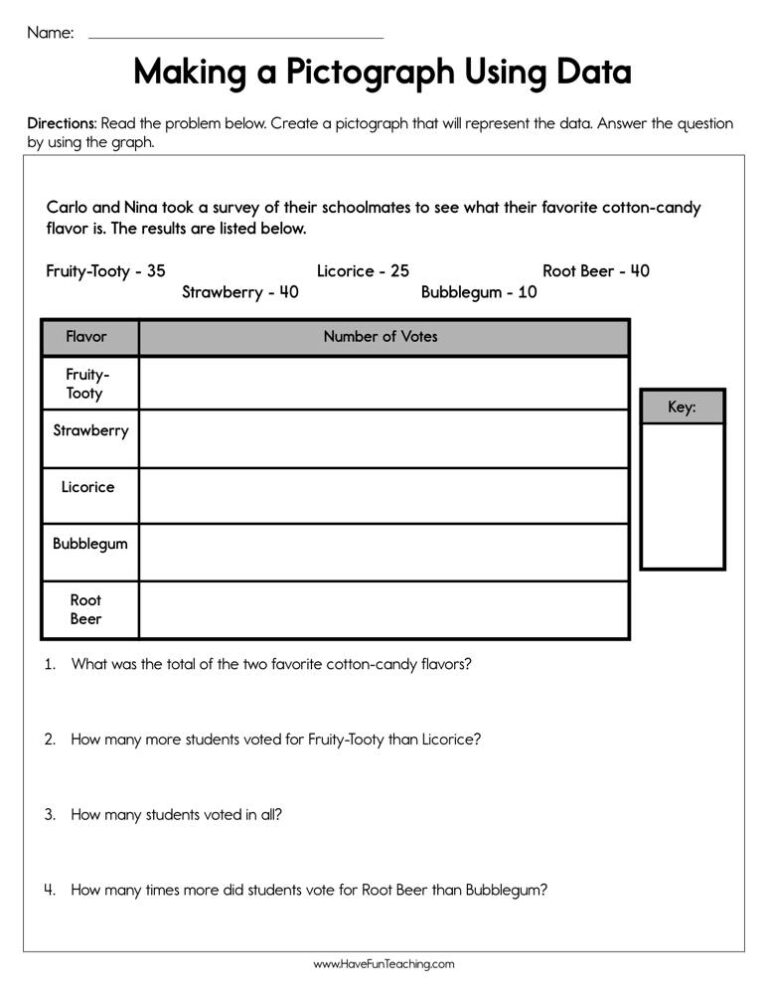
 Try it withMaking a Graph Using Data WorksheetWorksheetsOpen it →