
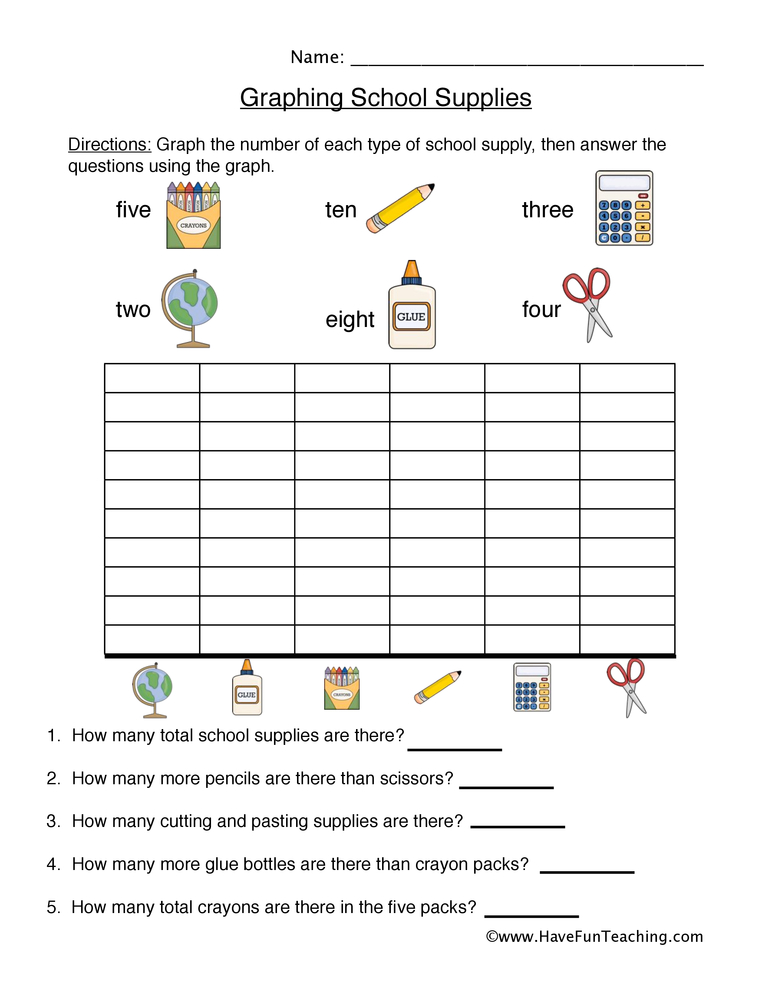
Back to School Graph Worksheet
This back to school graph worksheet has 2nd graders count a box of school supplies, color a bar graph from their own data, and answer three questions about it. Answer key included for fast, no-prep checking.
$6.97
Or free with a membership — members pay $3.33/mo for all 10,000+ resources. See plans
Want this one free?
Tell us where to send it and it’s yours — no card, no catch.
One free resource per teacher. We’ll also send free teaching ideas each week — unsubscribe anytime.
Teaching is easier with a membership
Unlimited printables, games & videos for PreK–6th — for your classroom or homeschool. Cancel anytime.
Start your 3-day free trial$0 today · cancel anytime · Instant access to 10,000+ resources
About this resource
Description
Collecting data, organizing it on a graph, and then reading answers back off that graph is one of the biggest math ideas in second grade, and this back to school graph worksheet teaches all three steps in one activity. Students count a scattered set of school supplies, build a single-unit bar graph from the numbers they found, and then use their finished graph to answer questions about how many, which is the most, and how many more. Because the data comes from their own counting rather than from numbers printed on the page, students see exactly where a graph comes from and why it is worth making.
This school supplies bar graph worksheet opens with a picture box holding twenty-one mixed school supplies: crayons, erasers, pencils, and a pair of scissors. Students count each kind of supply, color one square on the graph for every picture they counted, and then answer three questions using the graph they built. Print it for a back to school math center, a first-week review day, a small-group data lesson, or homework. A full answer key is included on the second page, so checking work takes seconds.
What’s Included
- 1 print-ready PDF worksheet
- A picture box with 21 school supplies to count and sort into four groups
- A single-unit bar graph with a 1 to 8 scale and labeled picture columns
- 3 graph questions covering how many, the most, and how many more
- A complete answer key
Three reasons this resource helps kids learn to graph. First, students build the graph from data they gathered themselves, so the bars mean something instead of being copied numbers. Second, the single-unit scale keeps the counting honest at second grade: one square always stands for exactly one picture, which is the foundation students need before scaled graphs arrive in third grade. Third, the questions move past simple reading into comparing, so students practice the take-apart thinking behind “how many more” while the answer is still sitting right in front of them in two bars.
Teachers and parents can stretch this back to school graph worksheet in several easy ways. Empty a real pencil box onto the table and graph what is actually inside it, then compare that graph to the one on the worksheet. Ask students to write one new question their graph can answer and trade papers with a partner. Survey the class on a favorite school supply and build a class-sized bar graph on chart paper. Snap the supplies into groups of ten to connect counting with place value, or repeat the count a week later and talk about what changed.
Related Resources
What teachers say
Reviews
You must be logged in to post a review.
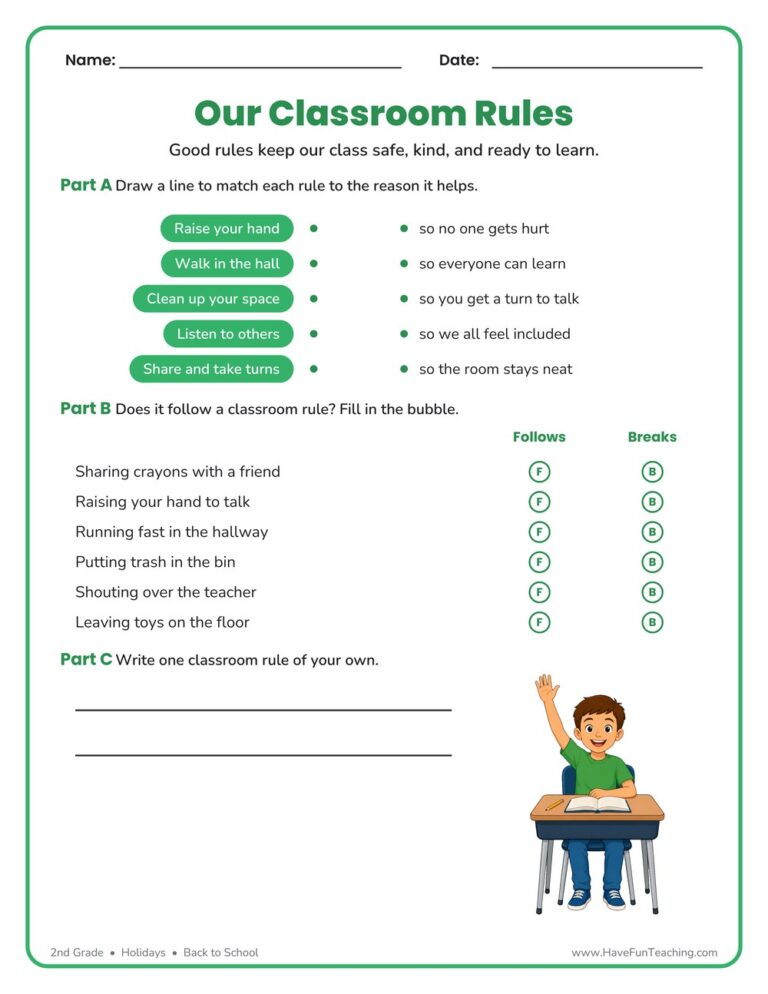
This Classroom Rules Worksheet helps 2nd graders match rules to reasons, sort classroom behaviors, and write a rule of their own. Includes an answer key — a friendly, no-prep way to begin the school year with clear expectations.
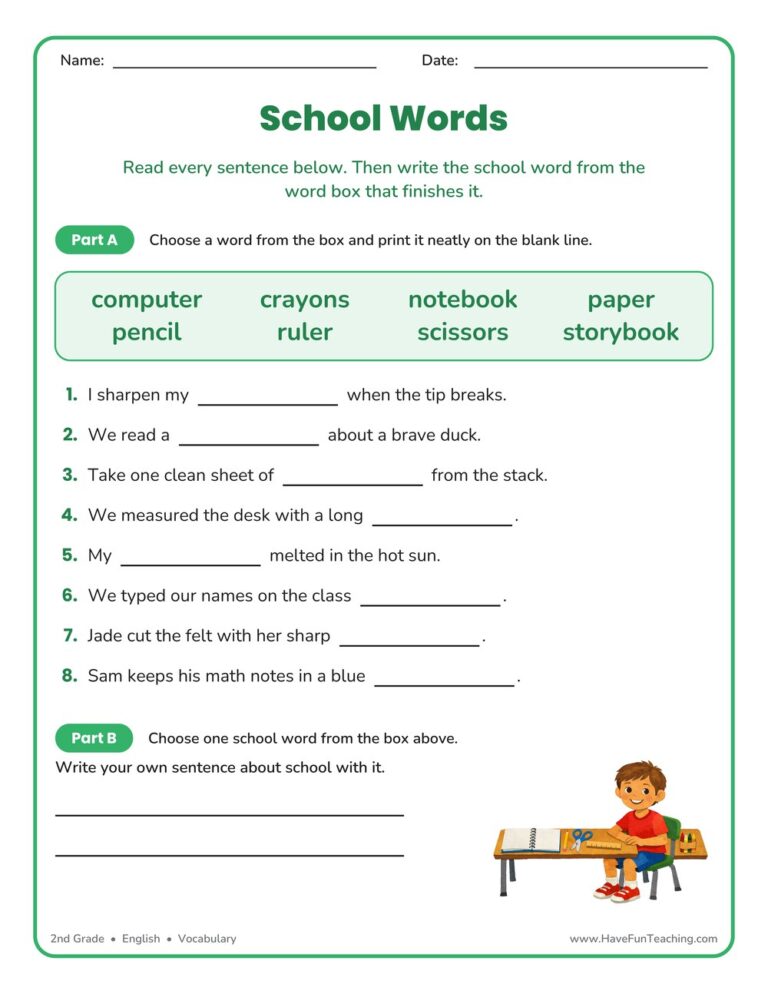
The School Words Fill in the Blank Worksheet gives 2nd graders eight sentences and a word box of everyday classroom words to complete. Answer key included, so this vocabulary practice needs no prep and checks itself in seconds.
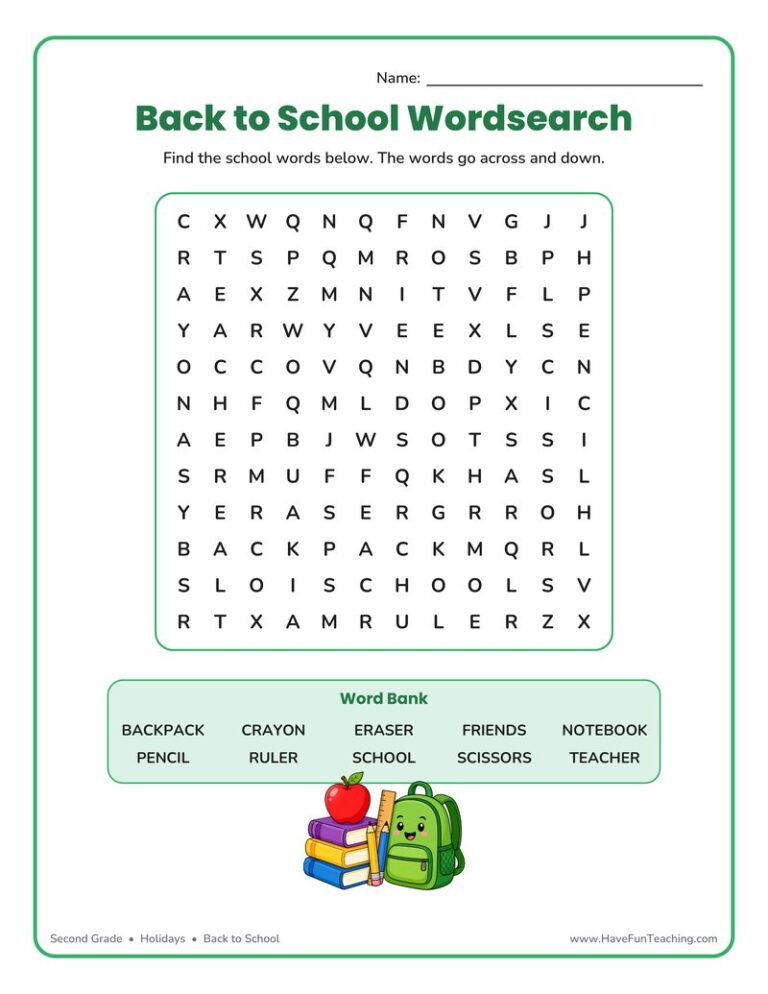
The Back to School Fun Word Search Worksheet gives 2nd graders a playful way to find ten hidden school words across and down. Includes an answer key — great no-prep vocabulary practice for the first weeks of school.
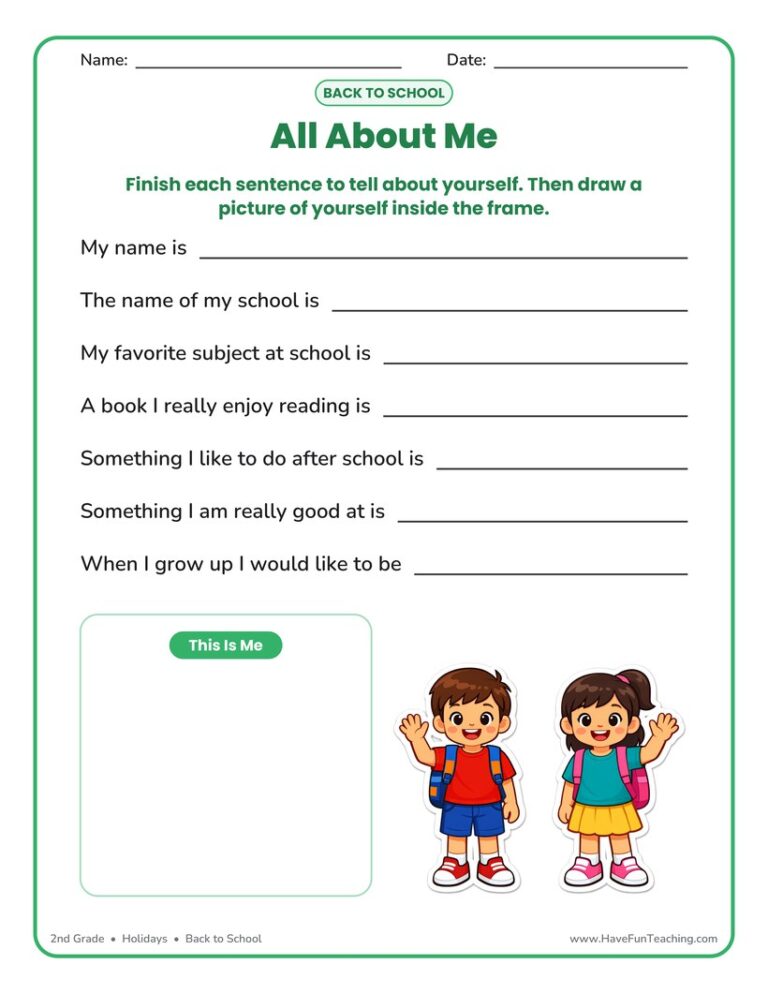
This All About Me Fill in the Blanks Worksheet lets 2nd grade students finish seven sentences about themselves and draw a self-portrait. An easy first-week page that gets your whole class talking.

This Free Second Grade Curriculum plan gives you everything you need to teach every Second Grade subject and skill for one year.

Using this School Subjects Word Wall, students use these common school terms in your word wall to build their vocabulary.
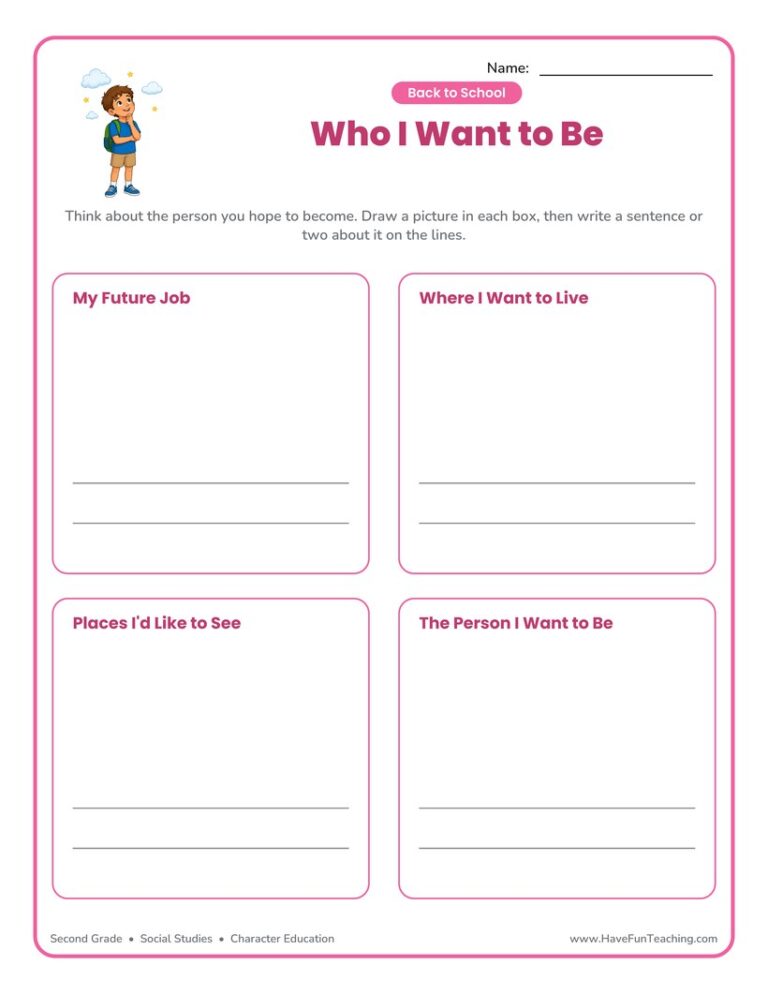
This Who I Want to Be worksheet lets second graders draw and write about their future job, home, dream destinations, and character. A warm back-to-school reflection that helps students set goals and share who they hope to become.
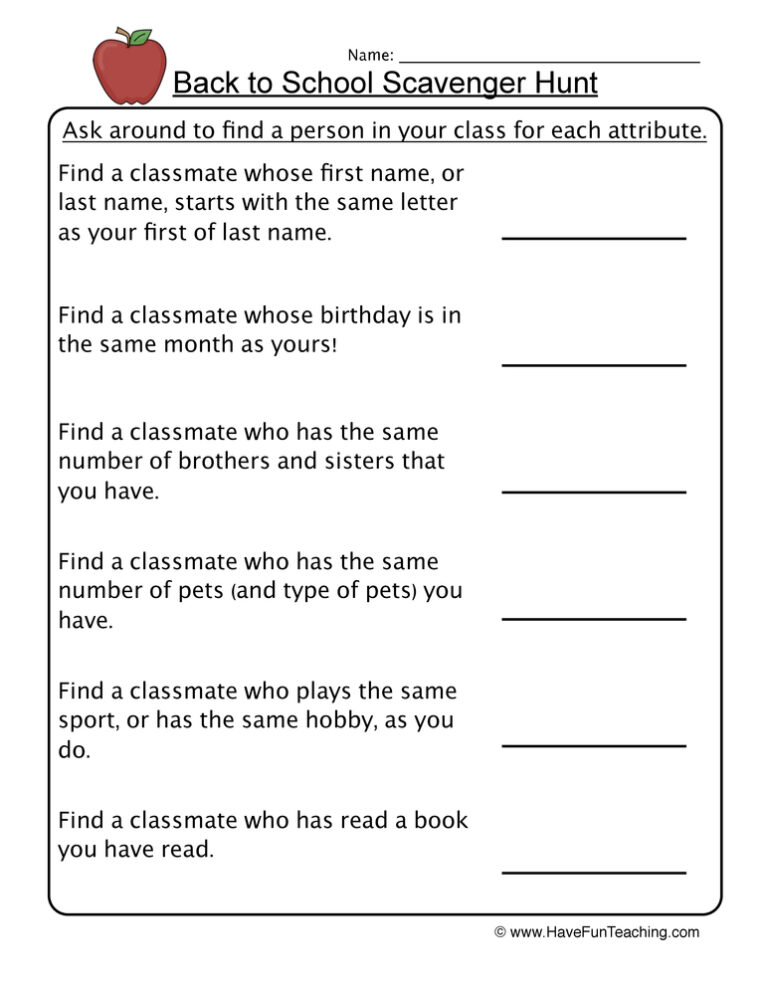
This back to school scavenger hunt worksheet sends 2nd grade students around the room with six friendly clues, so every child meets a classmate and starts the year already knowing a few names.
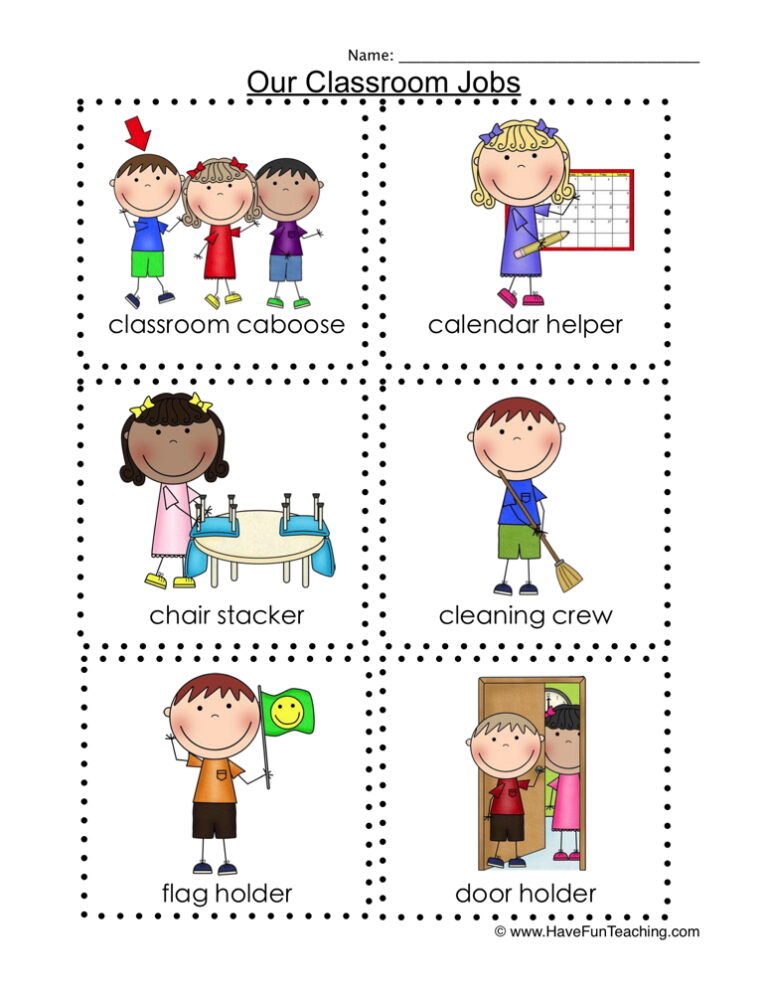
Using these Back to School Classroom Jobs Flash Cards, students know the different jobs that they can help do in your classroom.
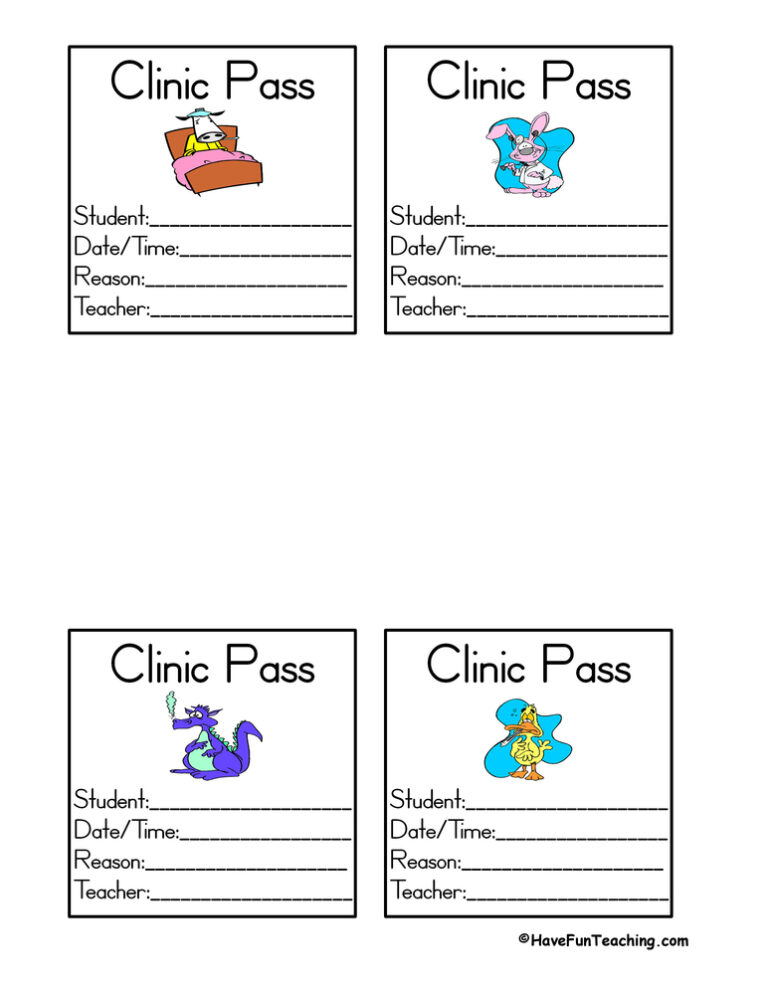
Using this School Hallway Clinic Passes, teachers can quickly write hallway passes so they can keep track of students who go to the nurse, library, or other parts of the school.
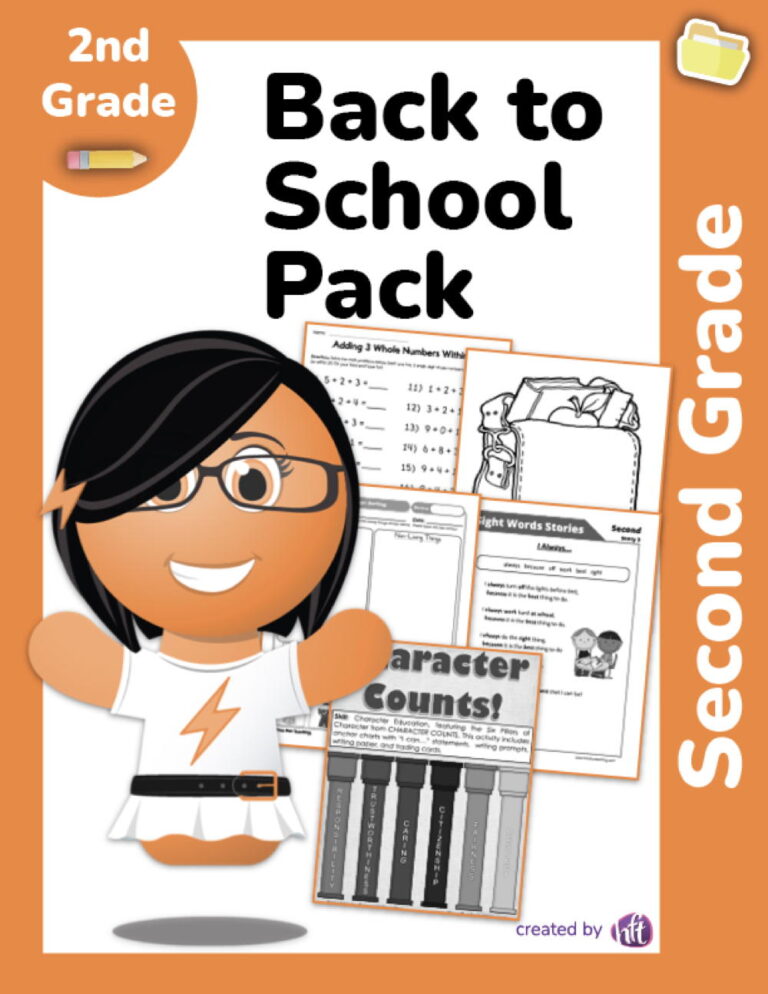
Use this Second Grade Back to School Pack to help your students during the first week of school. This back to school pack includes lots of teaching resources, including worksheets, activities, songs, videos, etc. for teaching English, Math, Reading, Science, Social Studies, and Writing. Sign up for a Have Fun…
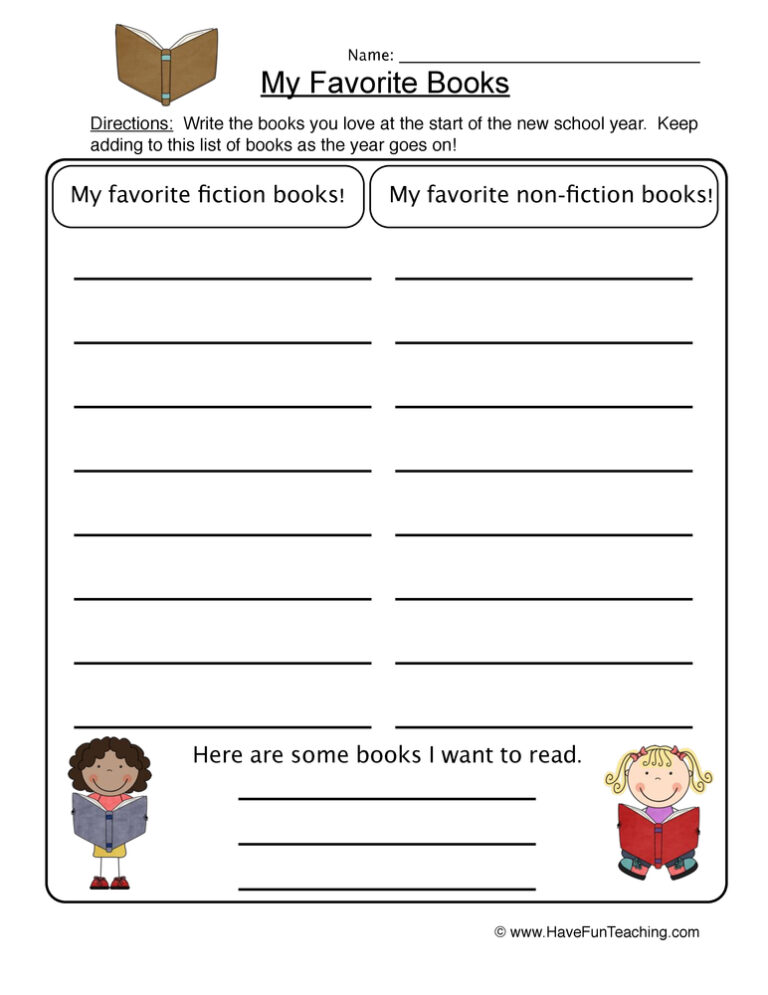
Using Fiction and Non-Fiction Favorite Books Worksheet, students create a list of their favorite fiction and non-fiction books that they have read.




Reviews
There are no reviews yet