

Thanksgiving Graph Worksheet
Students build a scaled bar graph from a class food survey in this Thanksgiving Graph Worksheet, then answer comparison questions about the data. Written for 3rd Grade, with an answer key included for fast checking.
$6.97
Want this one free?
Tell us where to send it and it’s yours — no card, no catch.
One free resource per teacher. We’ll also send free teaching ideas each week — unsubscribe anytime.
Free teacher account · no credit card
Membership
Get every game, song, & printable
- Every game, on any device
- 6,500+ resources
- Assign online with HFT Classroom
Then $39.97/year · cancel anytime · See plans
- Instant digital download
- Printable PDF + answer key
- Made by real teachers
Teacher / Family membership
Teaching is easier with every resource
One membership for your whole year: 6,500+ worksheets, games, songs and videos for Preschool–6th, for your classroom or homeschool.
- Unlimited printables & downloads
- Every game, on any device
- Assign online with HFT Classroom
- Cancel anytime
Teacher / Family membership · 3 days free
Yearly
Monthly would be $119.64 a year
$3.33/month
Billed $39.97 once a year
You save $79.67 every year
Start My 3 Free Days$0 today · cancel anytime
Monthly
$9.97/month
Flexible, month to month
Yearly is just $3.33/mo. Switch and save $79.67
Start My 3 Free Days$0 today · cancel anytime
About this resource
Description
Collecting data and showing it on a graph turns a pile of numbers into a picture a child can actually read. By third grade, students are expected to move past one-to-one counting and work with a scaled bar graph, where a single square on the grid stands for more than one thing. This Thanksgiving Graph Worksheet gives that skill a holiday setting: a class has voted on its favorite Thanksgiving food, and the results are waiting in a data table for your student to turn into a finished bar graph.
The page opens with a short survey table listing five foods — corn, turkey, cranberries, pumpkin pie, and rolls — and the number of students who chose each one. Because every square on the grid is worth two students, learners have to divide before they draw, which is what makes this 3rd grade graphing worksheet more than a copying exercise. Once the five bars are drawn, students use their own graph to answer a set of questions, including a two-step comparison and a short written explanation of a common mistake. A complete answer key is included, so the page works just as well for independent practice as it does for guided small-group work.
What’s Included
- 1 print-ready PDF worksheet
- Answer key
- A five-category class survey table, a scaled bar graph to build, and 4 data questions including a two-step comparison and a written explanation
There are three reasons this Thanksgiving Graph Worksheet helps students lock in graphing. First, the scale of two forces real number sense, because a child cannot finish a single bar without halving the vote count first. Second, the questions climb in difficulty instead of repeating, moving from a straight read of the graph, to a comparison of two bars, to a two-step problem that combines two categories before subtracting. Third, the last item asks students to explain another child’s error in their own words, which is the step that turns a procedure into real understanding and mirrors the constructed-response items on state assessments.
Away from the page, keep the skill alive with quick surveys your students already care about. Poll the class on favorite side dishes, count how many people are coming to dinner at each family’s house, or tally the colors of the leaves collected on a fall walk, then build a graph together on chart paper using a scale of two, five, or ten. Ask questions out loud while the data is still fresh: which bar is tallest, how many more people chose one option than another, and what would change if every square counted five votes instead of two. Older students can graph the same data twice at two different scales and explain why both graphs are correct.
Related Resources
What teachers say
Reviews
Write a review, earn store credit
Get 25¢ in credit for every approved review of a resource you’ve downloaded, played or purchased — up to 15 a month. Credit applies automatically to your membership payments, so your reviews can help pay for your membership.
Honest reviews only — any star rating earns the same. Program rules
Log in to write a review and earn store credit.
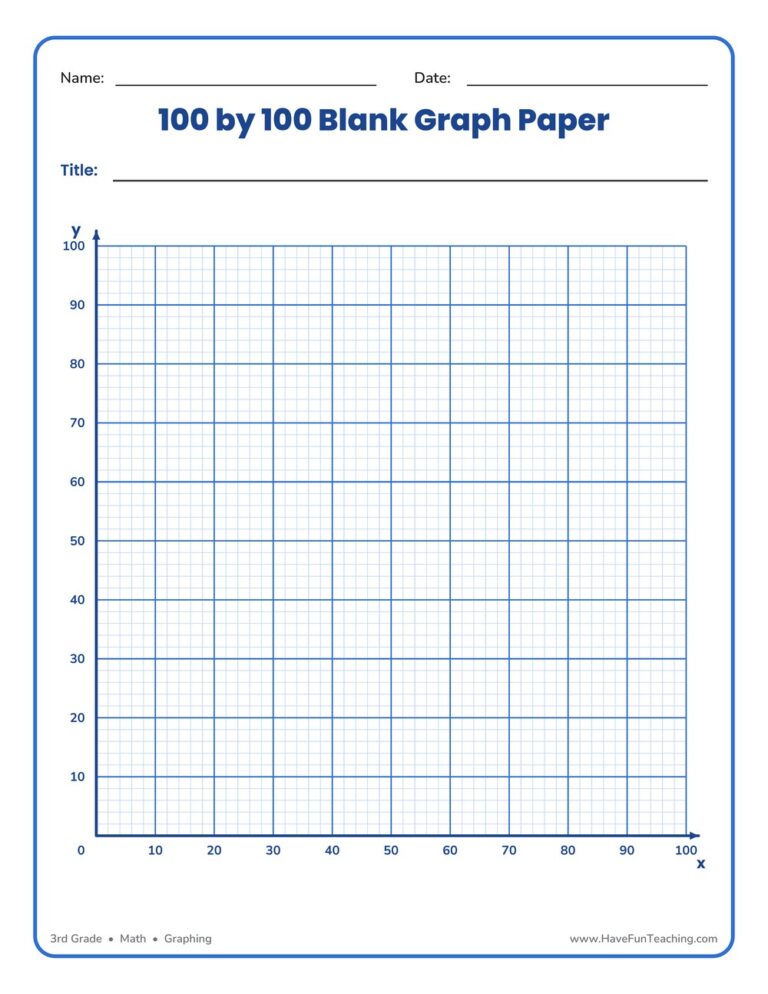
This 100 by 100 blank graph paper worksheet gives 3rd graders a ready-made coordinate grid numbered to 100 by tens — perfect for plotting points, building bar graphs, and organizing data with no prep required.
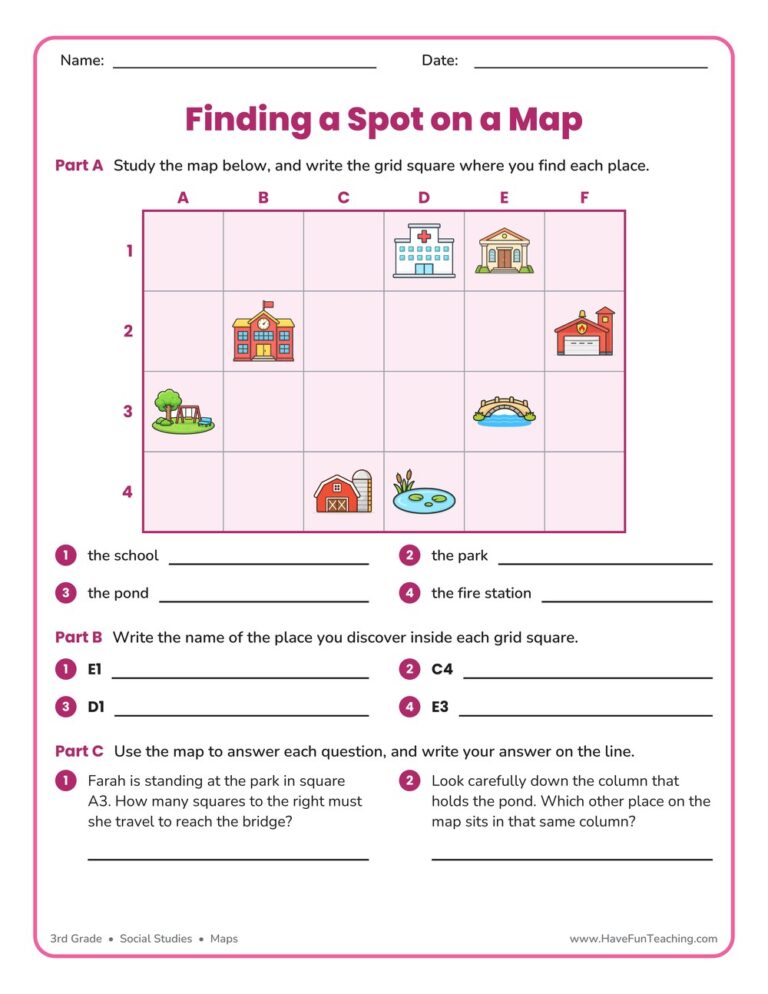
A finding a spot on a map worksheet for 3rd grade, built on one labeled town grid with place-to-square, square-to-place, and reasoning questions. Answer key included for quick no-prep map skills practice.
A Florida FAST 3rd grade math practice test workbook for teachers, with a pretest, skill practice for all 34 benchmarks, mixed review and 2 full-length practice tests. Answer key included, so test prep is ready to go.

This making a graph using data worksheet has 3rd graders build a scaled bar graph from an orchard data table, then answer four questions about it. An answer key is included, so graphing practice needs no prep.
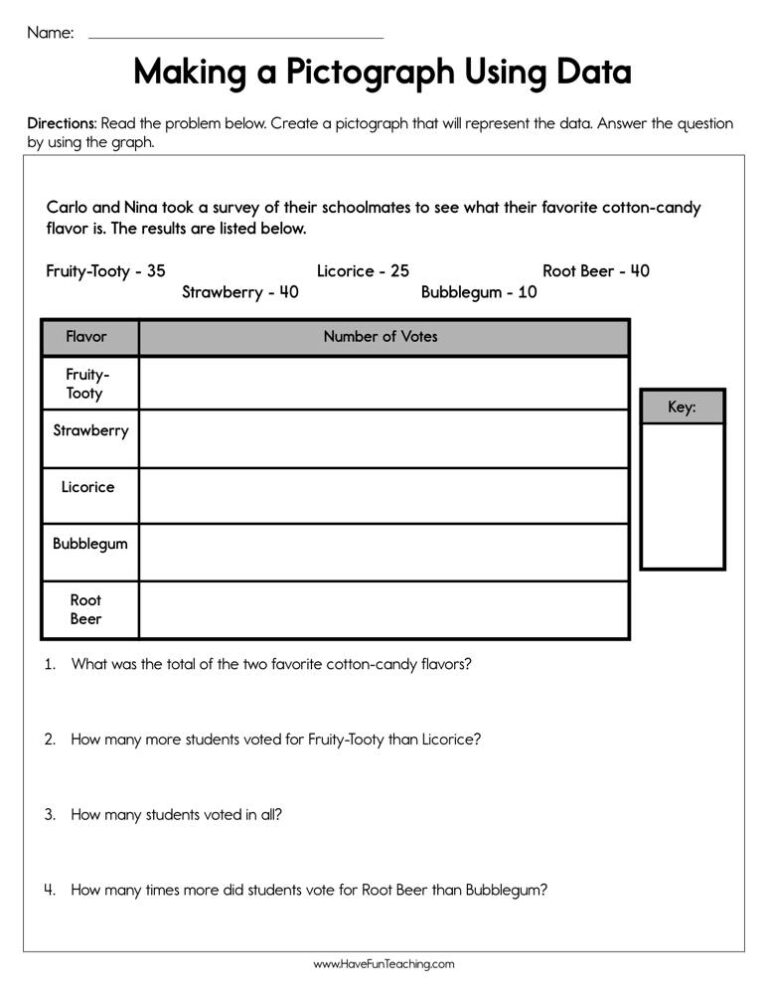
A Making a Pictograph Using Data Worksheet for 3rd Grade: students draw one star for every five votes, then read, compare, and explain their graph. Answer key included for easy, no-prep graphing practice.

This Multiplication Bar Graphs Worksheet has 3rd grade students solve six multiplication problems and graph each product on a scaled bar graph. An answer key is included, so checking work takes seconds.
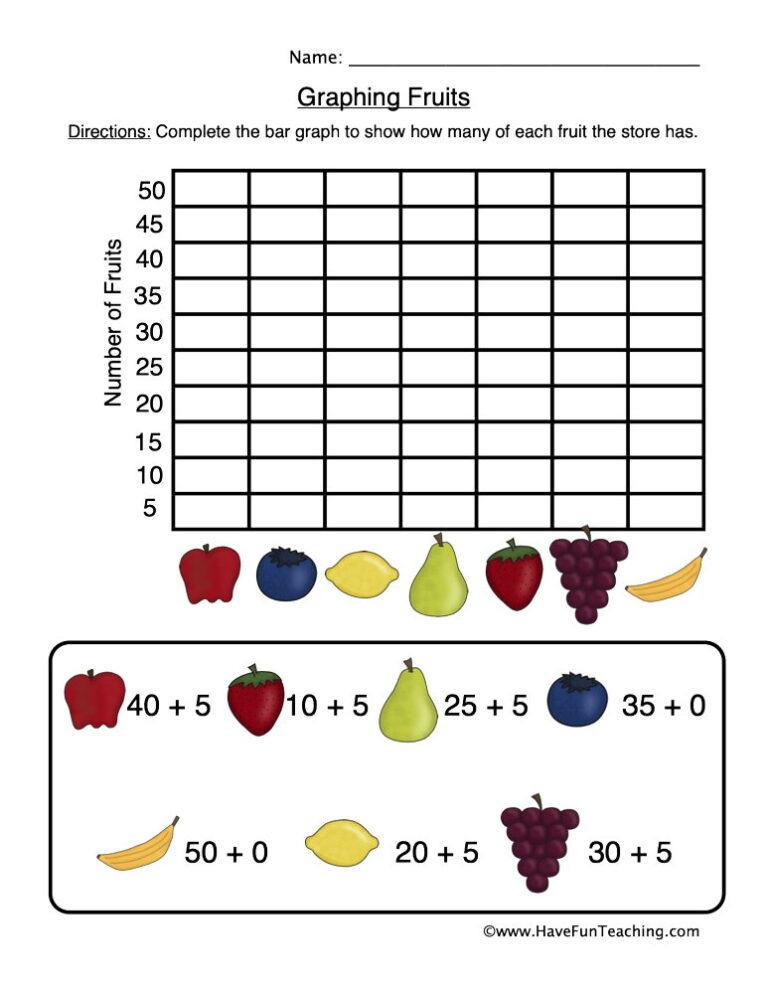
The Graphing Fruits Worksheet has 2nd grade students solve four addition facts, color a bar graph with their answers and read it to answer three questions, with a full answer key.

This organizing data using a bar graph worksheet has 3rd Grade students turn a data table into a scaled bar graph, then answer read, compare and two-step questions. An answer key is included.
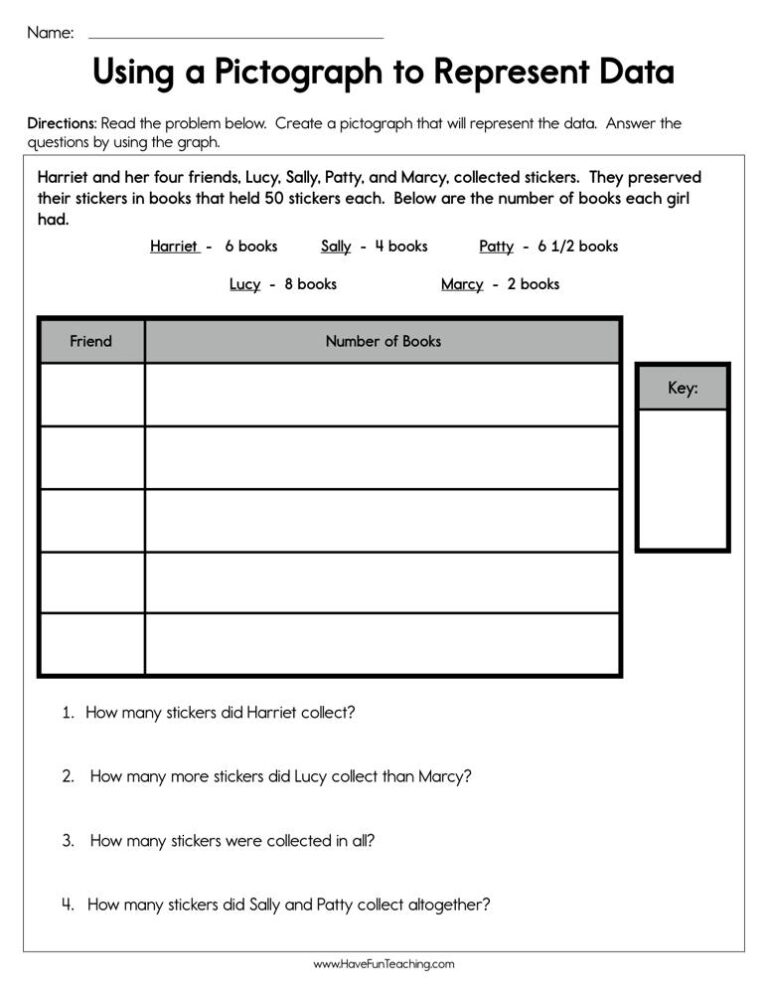
This using a pictograph to represent data worksheet has 3rd Grade students draw a scaled star graph, with half stars, from a sticker table. Answer key included for easy checking.

A blank pie graph worksheet where 3rd graders collect their own data, color the circle sections, and label a key. A reusable, no-prep template for hands-on graphing practice at home or school.
A Smarter Balanced (CAASPP / SBAC) 3rd grade math practice test workbook for teachers, with a pretest, skill practice for all 37 standards, mixed review and 2 full-length practice tests. Answer key included, so test prep is ready to go.

The Memorial Day Graphing Worksheet has 3rd Grade students skip count by twos, color a scaled bar graph, and answer four questions about it, with a full answer key so checking the work takes a minute.
Reviews
There are no reviews yet