

Graphing Fruits Worksheet
The Graphing Fruits Worksheet has 2nd grade students solve four addition facts, color a bar graph with their answers and read it to answer three questions, with a full answer key.
$6.97
Or free with a membership — members pay $3.33/mo for all 10,000+ resources. See plans
Want this one free?
Tell us where to send it and it’s yours — no card, no catch.
One free resource per teacher. We’ll also send free teaching ideas each week — unsubscribe anytime.
Teaching is easier with a membership
Unlimited printables, games & videos for PreK–6th — for your classroom or homeschool. Cancel anytime.
Start your 3-day free trial$0 today · cancel anytime · Instant access to 10,000+ resources
About this resource
Description
The Graphing Fruits Worksheet asks second graders to solve four addition facts and then turn their answers into a bar graph. Graphing is how a child takes numbers that are scattered around and lines them up so they can be compared at a glance. Once the bars are colored in, questions like which fruit there is the most of, or how many more apples than pears, stop being arithmetic and become something the student can simply see. That move from a number to a picture and back again is the whole point of the page.
The Graphing Fruits Worksheet keeps the work on one page and the answers on the next. Each fruit card shows a picture and an addition fact, so the student adds first, writes the sum in the box, and then colors that many squares in the fruit’s column. The bar graph uses a single unit scale, which is exactly the scale second graders are expected to build. Three questions at the bottom ask them to read the graph they just made, including one compare question. Because this 2nd grade graphing worksheet is print and go, nothing needs preparing. Print it and hand it out, or use it as a math center that students can finish on their own.
What’s Included
- Four picture cards, each with an addition fact within twenty and an answer box
- A blank bar graph with a single unit scale from one to ten and four labeled columns
- Full color apple, banana, lemon and pear artwork on the cards and under each column
- Three questions that ask students to read and compare the graph they built
- A complete answer key on the second page with every bar colored in
Three Reasons This Helps Kids
- Solving the fact before graphing it means the numbers are the student’s own, so the graph feels like something they made rather than something they copied.
- A single unit scale keeps the counting honest, which is what makes a scaled graph readable later on.
- The compare question teaches students to answer with the picture instead of starting the subtraction over from scratch.
Teacher and Parent Ideas
- Have students color the bars with the real fruit colors so the graph is easy to read from across the room.
- Ask each student to write one more question their finished graph can answer, then trade papers.
- Bring in a real bowl of fruit and build a class graph on the board before handing out the page.
- Use the cards alone as a quick addition warm up on a different day.
Related Resources
What teachers say
Reviews
You must be logged in to post a review.
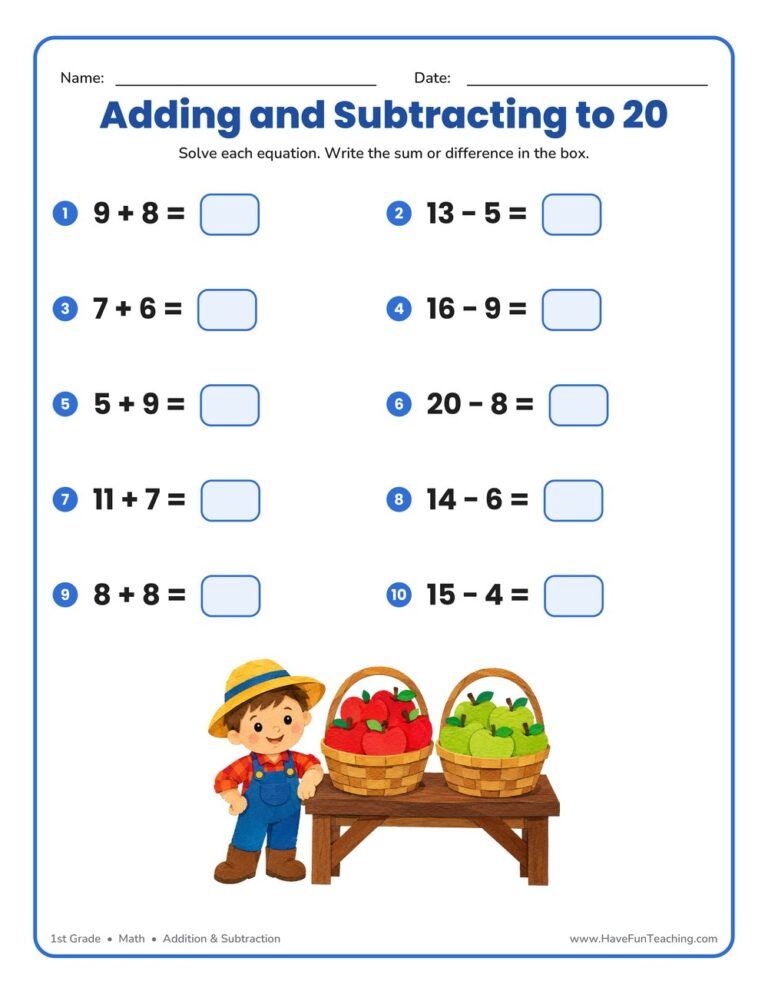
This adding and subtracting to 20 worksheet gives 1st graders ten mixed addition and subtraction equations to solve within 20. Answer key included — perfect for quick, no-prep math fact practice at home or school.

This adding and subtracting within 20 worksheet gives first graders mixed addition and subtraction fact practice with a helpful number line. Includes a complete answer key for quick, no-prep math review.
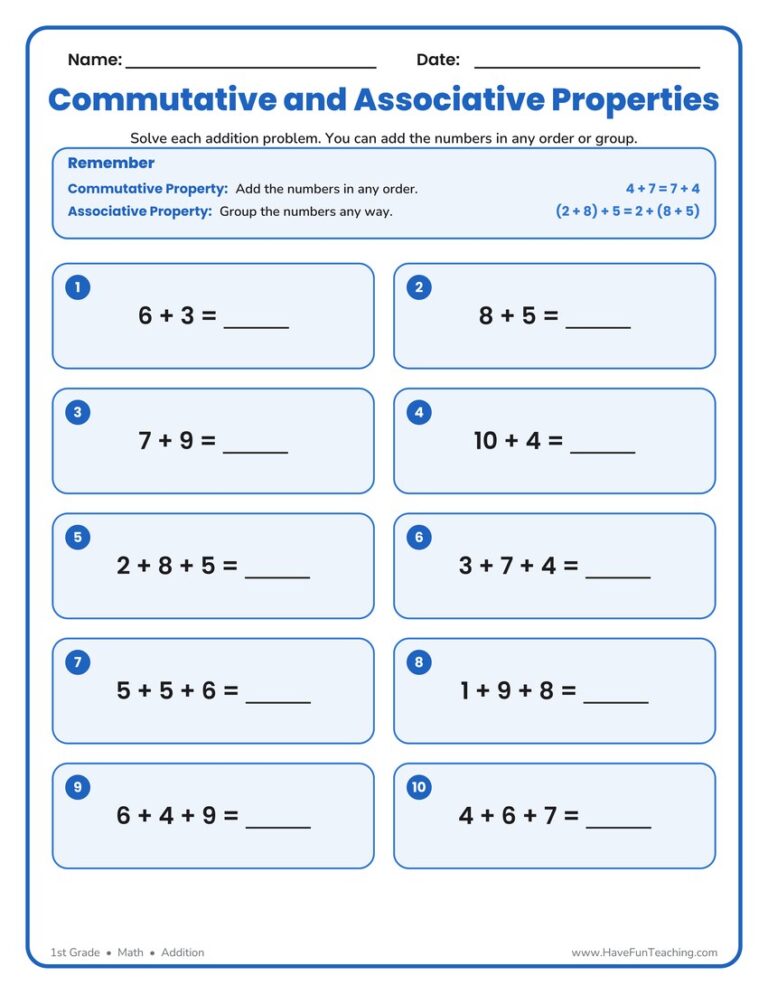
A first-grade commutative and associative properties worksheet where students solve ten addition problems by adding the numbers in any order or group. Includes an answer key and a handy reminder box for no-prep math practice.

This counting on to add worksheet helps 1st graders start from the bigger number and count forward on a number line to twenty. An answer key is included, so checking work takes seconds.
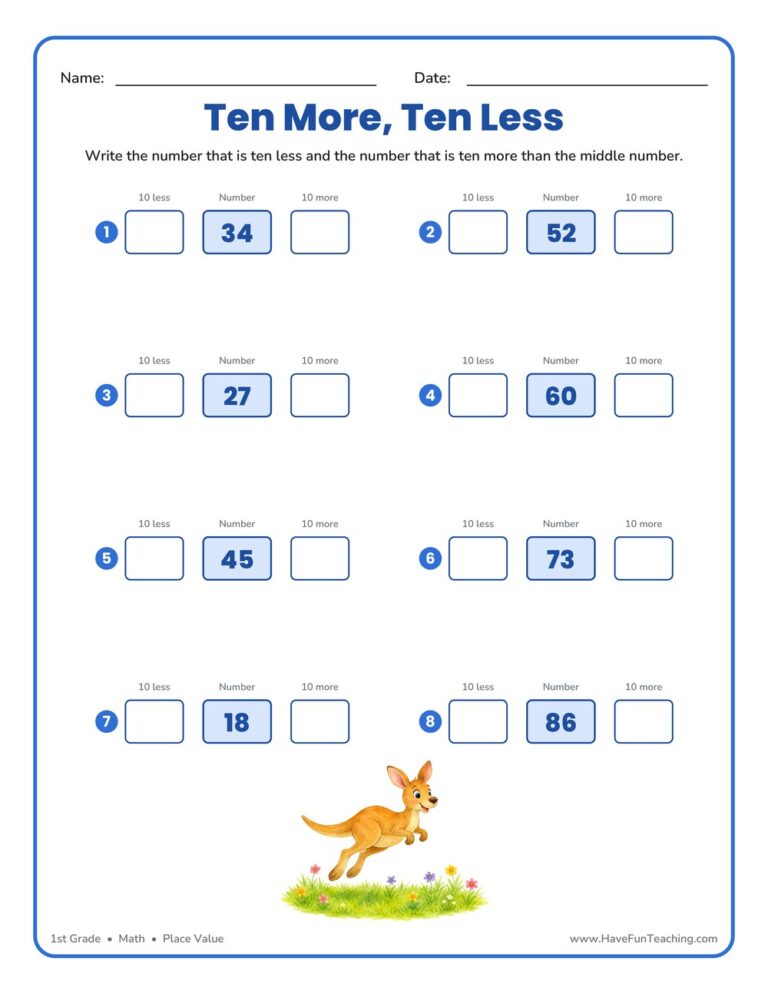
This Ten More Ten Less Worksheet gives 1st graders eight quick problems to find ten more and ten less than a two-digit number. Includes an answer key for fast, no-prep place value practice.

This Adding In Any Order Worksheet helps 1st graders see that 3 + 4 and 4 + 3 always match, using picture groups first and quick fact flips second. Answer key included, so practice takes minutes to check.

This Adding 3 Whole Numbers Within 20 Worksheet gives 1st graders twelve problems to practice adding three single-digit numbers for sums up to 20. Includes a complete answer key for fast, no-prep addition practice.

This finding the missing number worksheet gives first graders focused practice solving for the unknown number in addition and subtraction equations within 20. Includes an answer key — a quick, no-prep way to build number sense and fact fluency.
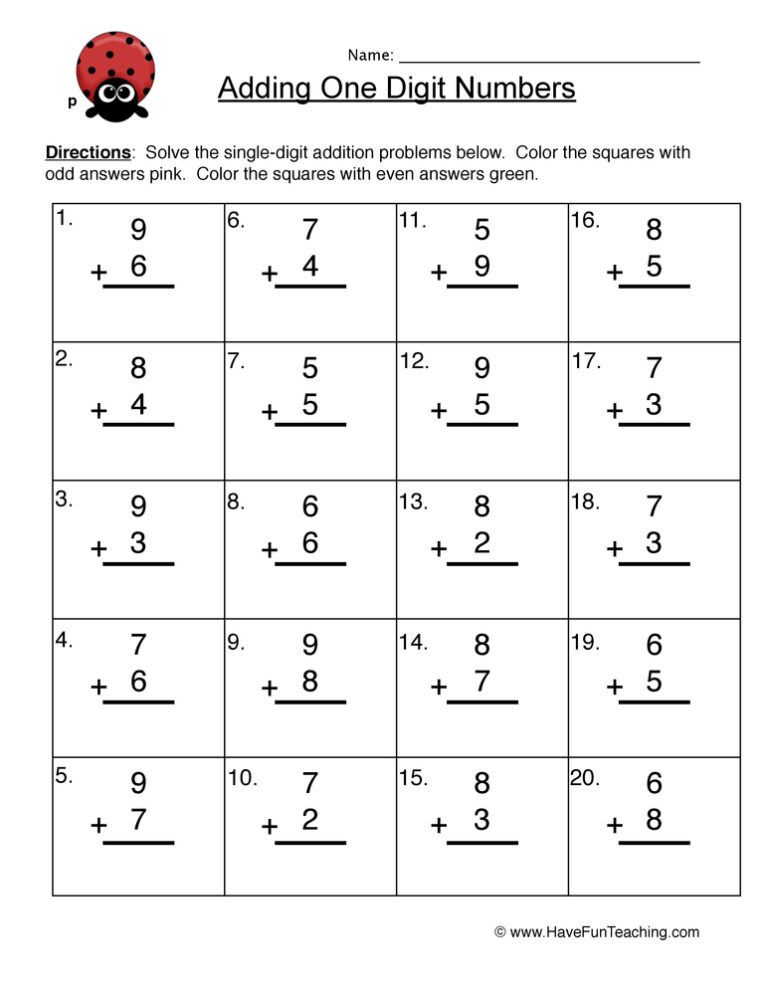
This single digit addition problems worksheet gives 1st graders twelve column facts to 18 plus an illustrated bird word problem. Answer key included, so students build fact fluency with no prep for you.
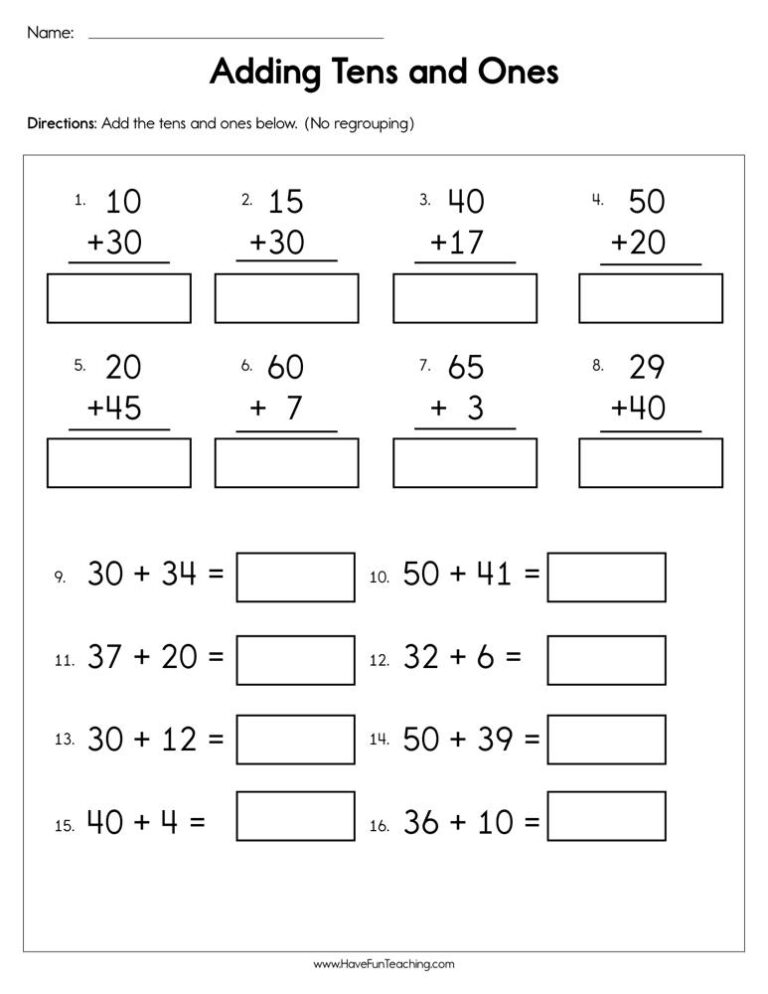
This adding tens and ones worksheet helps 1st graders build two-digit numbers with base ten blocks and column addition. Includes an answer key for quick, no-prep place value practice at home or school.

This Adding to Solve Subtraction Problems Worksheet helps 1st graders solve subtraction facts within 20 by finding the missing addend. Six paired problems and a story problem, with an answer key included, build quick and confident fact fluency.

This Adding Word Problems with 3 Numbers Worksheet helps 1st graders add three single-digit numbers using fun story problems about ducks, apples, and more. Includes a complete answer key for quick, no-prep addition practice.




Reviews
There are no reviews yet