

Making a Graph Using Data Worksheet
This making a graph using data worksheet has 3rd graders build a scaled bar graph from an orchard data table, then answer four questions about it. An answer key is included, so graphing practice needs no prep.
$6.97
Or free with a membership — members pay $3.33/mo for all 10,000+ resources. See plans
Want this one free?
Tell us where to send it and it’s yours — no card, no catch.
One free resource per teacher. We’ll also send free teaching ideas each week — unsubscribe anytime.
Teaching is easier with a membership
Unlimited printables, games & videos for PreK–6th — for your classroom or homeschool. Cancel anytime.
Start your 3-day free trial$0 today · cancel anytime · Instant access to 10,000+ resources
About this resource
Description
Making a graph is how children turn a plain list of numbers into a picture they can read at a glance, and this making a graph using data worksheet walks 3rd graders through both halves of that skill. First they build the graph, then they read it back. Third grade is the year bar graphs stop being one-to-one: each square now stands for more than one thing, so a student has to work out how tall a bar should be instead of simply counting boxes. That single step is what separates copying a number from understanding a scale, and it is the step this printable is built around.
This 3rd grade bar graph worksheet is a two page, no prep printable. Part A gives students a data table of five kinds of fruit picked at an orchard, along with a labeled grid where every square stands for 2 baskets. Students read the table and draw a bar for each fruit, working out each height from the scale. Part B then asks four questions about the graph they just built: one straight read, one comparison, one two-step problem that combines two categories, and one question that asks them to explain a classmate’s mistake in their own words. Page two is the complete answer key with every bar drawn in. Point out the scale before students begin, and have them say each bar height out loud before they draw it.
What’s Included
- 1 print-ready PDF worksheet
- Answer key
- 1 data table and 1 labeled bar graph grid with a scale of 2
- 4 questions: a graph read, a comparison, a two-step problem and a written explanation
There are three reasons this making a graph using data worksheet helps children learn. First, students both construct and interpret the same graph, so the numbers in the table and the bars on the grid stay connected instead of becoming two unrelated exercises. Second, the scale of 2 forces real reasoning: a child who counts one square per basket will draw every bar twice as tall, and the last question makes that exact error visible and fixable. Third, the questions climb from reading a single bar to comparing two bars to combining two categories, so a student who can do the first is pulled toward the harder ones rather than stopped by them.
Teachers and parents can extend this activity easily. Collect your own class data, such as favorite fruits, pets at home, or the weather each day for a week, and graph it on the back of the page with a different scale. Ask children to write one new question their graph could answer, then trade with a partner. You can also hide the table, show only the finished graph, and challenge students to rebuild the numbers from the bars. For a quick warm up, practice counting by twos out loud so the scale feels familiar before the graphing starts.
Related Resources
What teachers say
Reviews
You must be logged in to post a review.
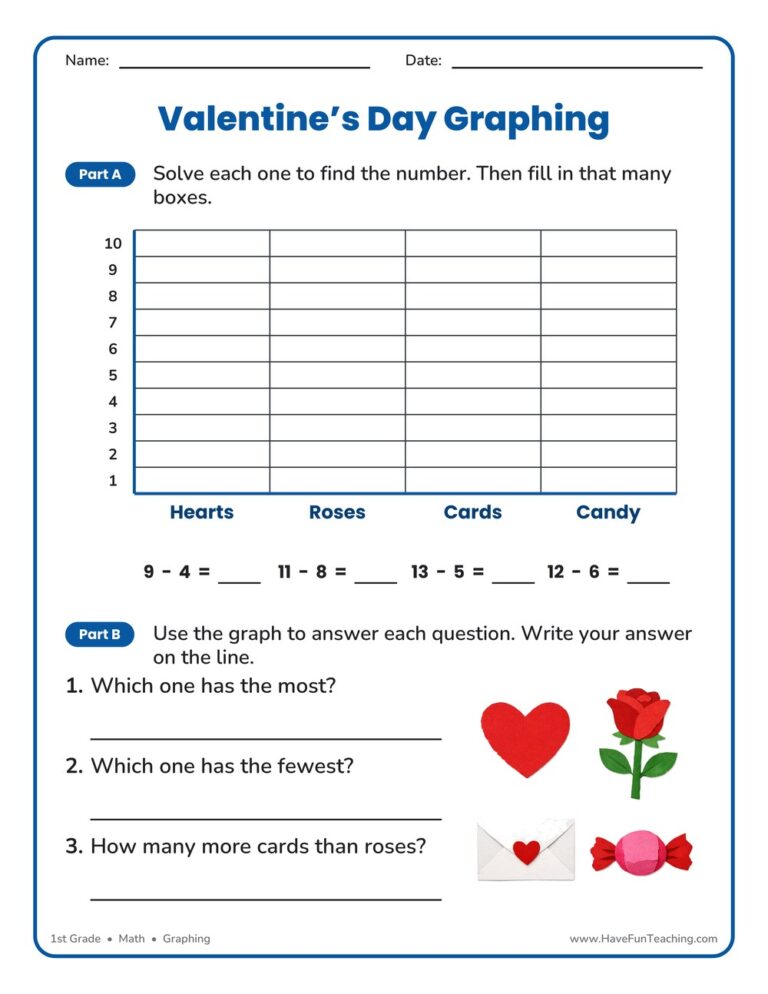
This Valentine's Day Graphing Worksheet has 1st Grade students solve four subtraction facts, fill in a bar for each answer, and read the graph they built. Answer key included, so checking takes seconds.
Using this Bar Graph Activity, students practice using data to create and analyze a bar graph.
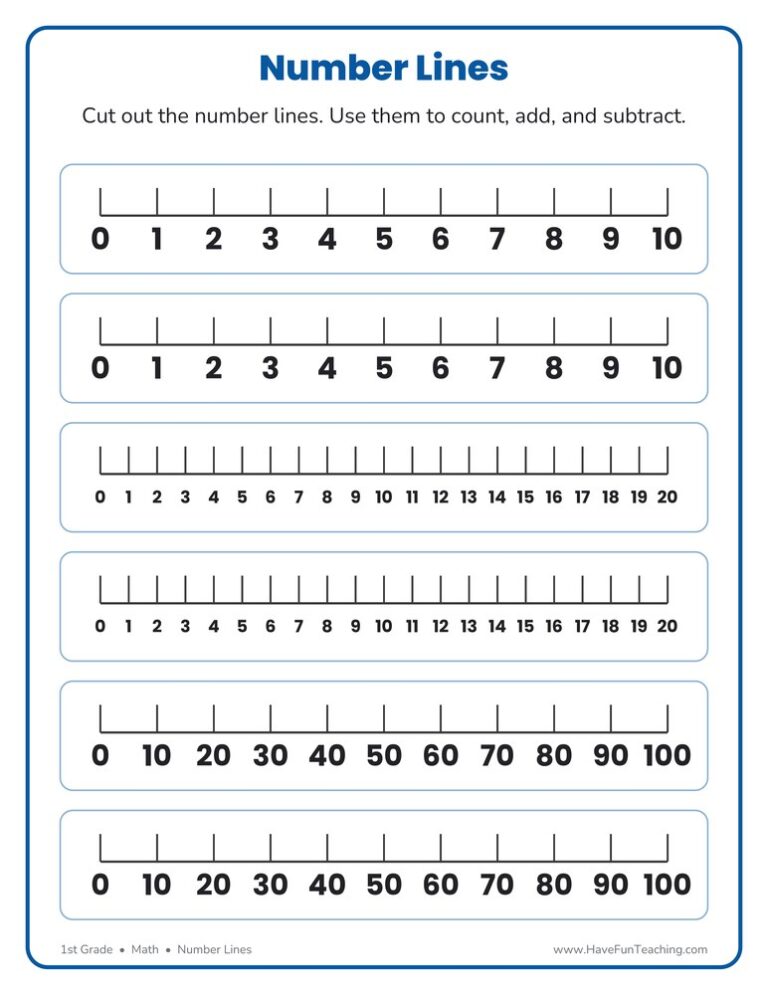
This number lines template worksheet prints six cut-out number lines for 1st grade: two to 10, two to 20, and two counting by tens to 100. Hand one to every student for counting, adding, and subtracting.
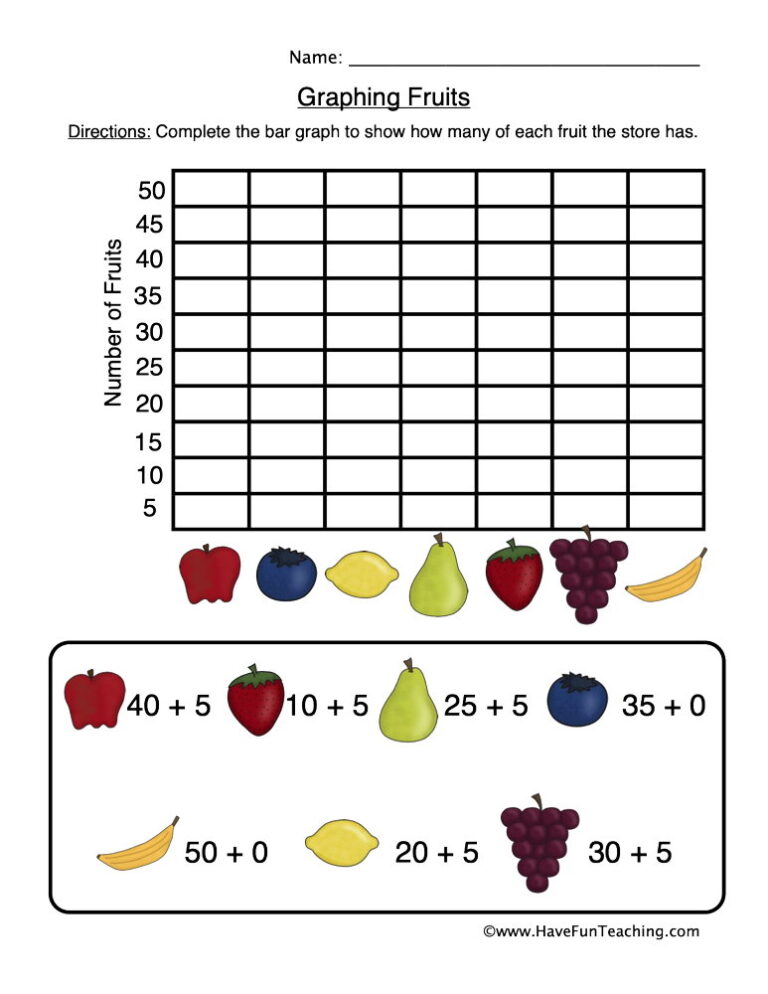
The Graphing Fruits Worksheet has 2nd grade students solve four addition facts, color a bar graph with their answers and read it to answer three questions, with a full answer key.

Using this Summer Graphing Activity, students use the summer spinner to tally what you spin by graphing results.

This Christmas cookies counting tally marks worksheet helps 1st grade students count holiday cookies, draw tally marks and read tally groups by fives. An answer key is included for quick, confident checking.

Using this Sort Count Graph Activity, students count the amount of fruits and vegetables to record them on a graph.

This graphing school tools worksheet has 1st graders count 18 backpacks, markers and rulers, color a bar graph from their own count, and answer three questions about it. Answer key included for fast, no-prep data practice.

Using this Gathering Information from a Graph Worksheet, students answer questions about balloons for a party using the data from the graph.

Using this Graphing Bugs Worksheet, students analyze the number of bugs at the zoo in a bar graph.

Using this Using a Graph to Gather Information Worksheet, students answer the questions about the farm animals using the data in the graph.
Using this 1.MD.4 First Grade Common Core Lesson, students count the amount of fruits and vegetables to record them on a graph.




Reviews
There are no reviews yet