

Christmas Bar Graph Worksheet
Students use this Christmas Bar Graph Worksheet to count tally marks for four Christmas animals, color in a 2nd Grade bar graph, and compare the bars. An answer key is included, so checking work takes seconds.
$6.97
Or free with a membership — members pay $3.33/mo for all 10,000+ resources. See plans
Want this one free?
Tell us where to send it and it’s yours — no card, no catch.
One free resource per teacher. We’ll also send free teaching ideas each week — unsubscribe anytime.
Teaching is easier with a membership
Unlimited printables, games & videos for PreK–6th — for your classroom or homeschool. Cancel anytime.
Start your 3-day free trial$0 today · cancel anytime · Instant access to 10,000+ resources
About this resource
Description
Reading and building a bar graph is one of the first real data skills a second grader meets, and this Christmas Bar Graph Worksheet gives them a festive way to practice it. Students look at a set of tally marks, count how many of each Christmas animal the class spotted, and turn those counts into a single-unit bar graph they color in themselves. Because the data is gathered for them, all of their attention goes to the two ideas that matter: one box always stands for one animal, and the height of a bar tells you how many.
Part A of this Christmas graphing worksheet shows four Christmas animals — a reindeer, a penguin, a polar bear, and a snowy owl — each with its own set of tally marks underneath. Students count the marks, then color one box in the graph for every mark they see. Part B asks four questions that send them straight back to the graph they just built: which bar is tallest, how many more of one animal than another, how many two animals make together, and how many animals there are in all. A full answer key sits on the last page.
What’s Included
- One printable Christmas Bar Graph Worksheet (PDF)
- Four sets of tally marks to read and count
- An eight-row, four-column single-unit bar graph to color
- Four compare and put-together questions
- A complete answer key
There are three reasons teachers keep this page in the December folder. First, it walks through the whole data cycle on one sheet — read the data, represent the data, then interpret it — instead of stopping at the picture. Second, the tally marks give students a second counting strategy to rehearse, because a group of five is read as five and the leftovers are counted one at a time. Third, the questions ask for subtraction and addition inside a real context, so the number work has a reason behind it and the answers can be checked against the bars.
Teachers can use this sheet as a whole-class warm-up, a math center, morning work, or an early-finisher activity, and it laminates well for repeated use with a dry-erase marker. At home, parents can extend it by collecting their own data — count the ornaments on the tree by color, the cards that arrive in the mail, or the cookies on each plate — and graphing those numbers on a blank grid. Ask an older sibling to write one new comparison question for the graph, then trade papers and answer each other’s.
Related Resources
What teachers say
Reviews
You must be logged in to post a review.

The Life Cycle of a Butterfly Worksheet has 2nd graders label the egg, larva, pupa, and adult stages and put them in the correct order. Answer key included for quick, hands-on life science practice.

This matching animal habitats worksheet has 2nd Grade students connect five animals to the ocean, pond, desert, forest, and grassland, then finish three sentences. An answer key is included for fast, no-prep science practice.
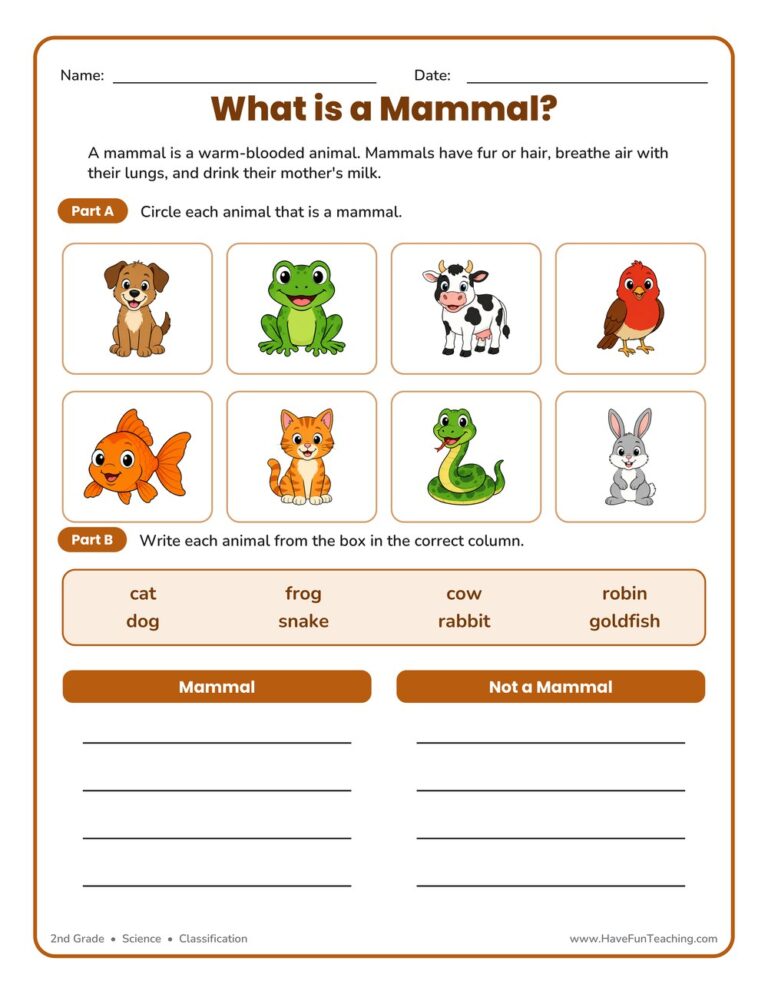
This mammal classification worksheet helps 2nd graders spot mammals and sort animals into mammal and not-a-mammal groups. It includes a complete answer key, making it perfect for no-prep science practice at home or in the classroom.

An animals bar graph worksheet for 2nd grade: students color one box per animal to build a four-category bar graph, then compare and add using it. Answer key included, so checking data work takes seconds.
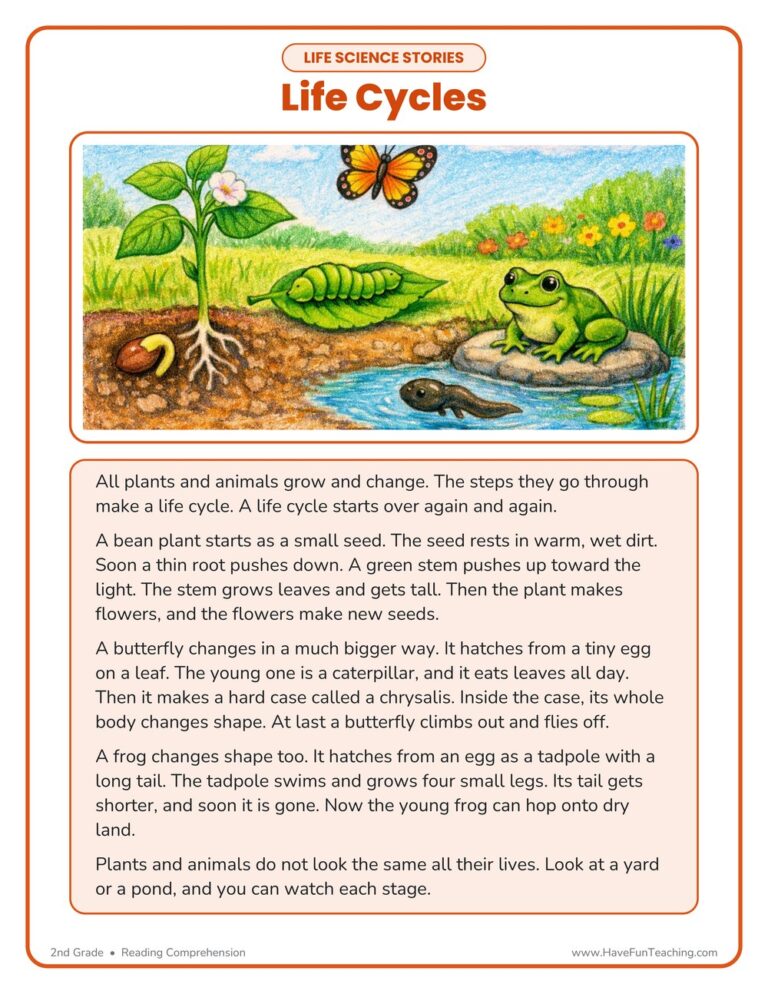
This Life Cycles Life Science Reading Comprehension Worksheet gives 2nd Grade readers a non-fiction story about seeds, caterpillars, and tadpoles, plus bubble, word-bank, and writing questions. Answer key included for fast, no-prep practice.
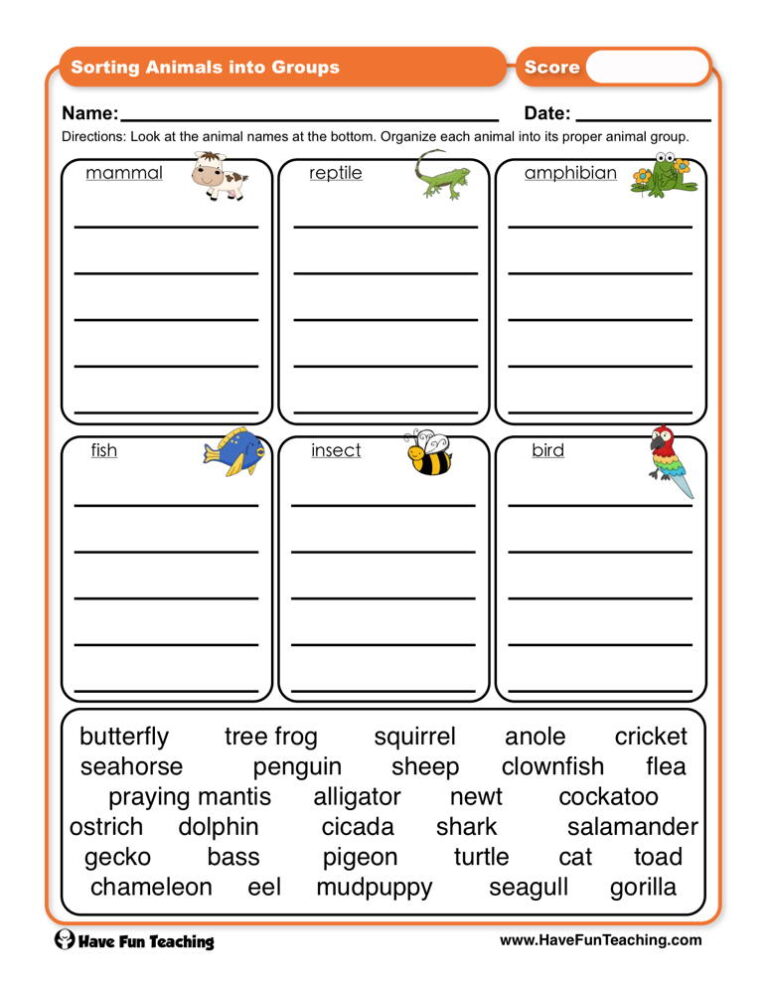
Practice animal classification with this Sorting Animals into Groups Worksheet for 2nd grade. Students sort twelve animals into six groups, with an answer key included for easy checking.

Using this Animal Song (Animated Music Video), your students learn about different types of animals and their sounds by watching this fun, catchy video.
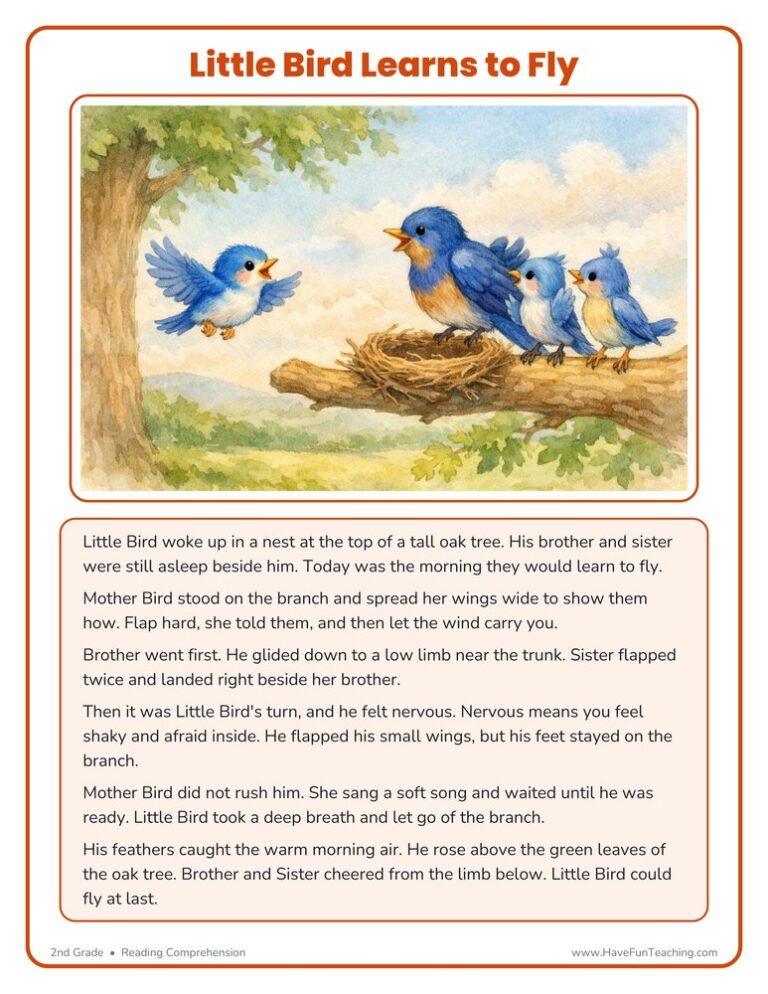
This Little Bird Learns to Fly Reading Comprehension Worksheet gives 2nd graders an illustrated animal story plus six questions on main idea, vocabulary, sequence, and inference. Answer key included for fast, no-prep reading practice.

This mammal fish bird worksheet asks 2nd graders to name the animal group for six pictures and four trait clues. An answer key is included, so checking the work takes only a minute.

This butterflies reading comprehension worksheet gives 2nd graders a short non-fiction passage on the butterfly life cycle, four bubble questions, and one written response. Answer key included for fast, no-prep practice.
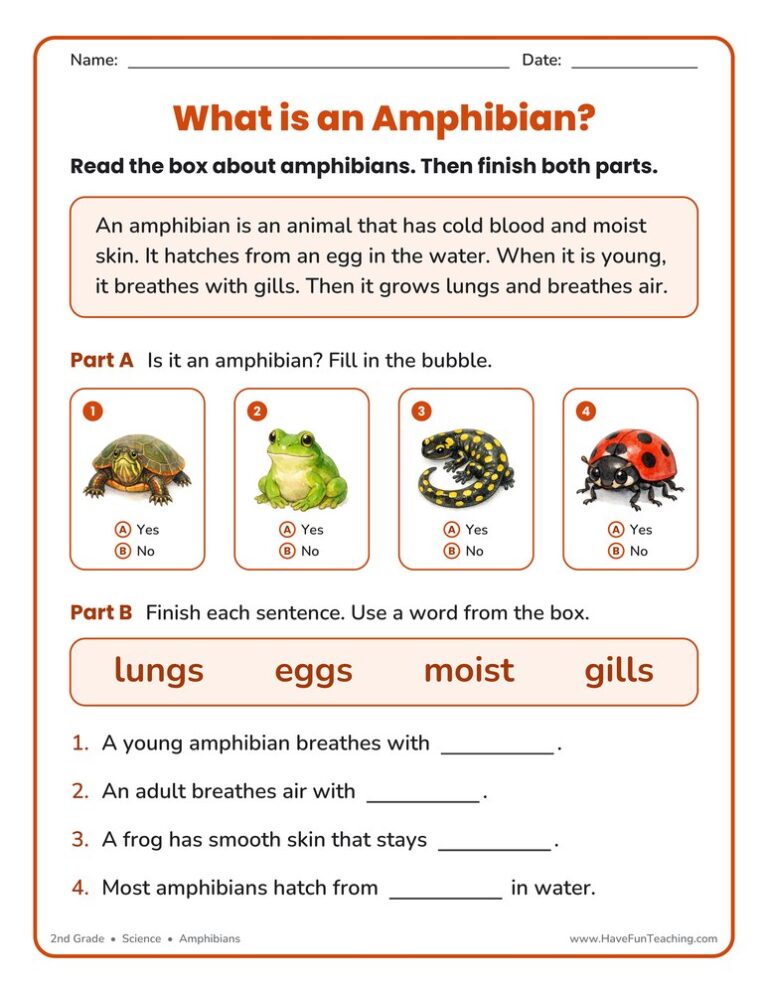
This amphibian classification worksheet asks 2nd graders to decide which animals are amphibians by checking their traits, then finish four sentences from a word bank. Answer key included for quick, no-prep science practice.
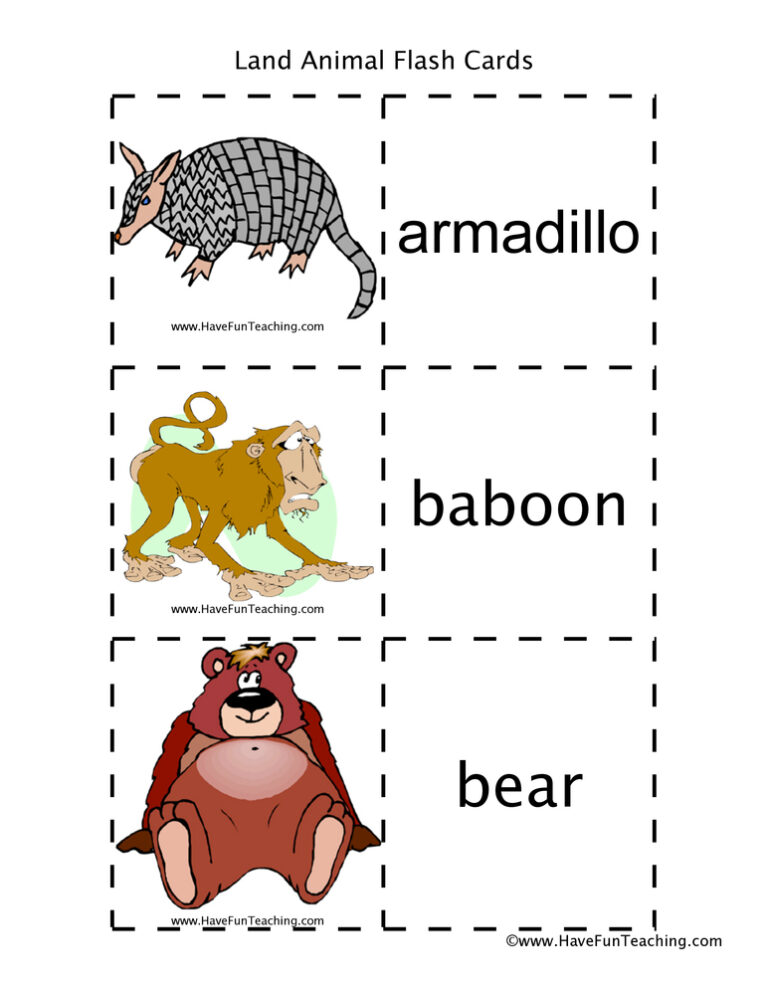
Using these Land Animal Flash Cards, students improve their Insect vocabulary by having a complete set of animal names they can use in their writing and discussions.




Reviews
There are no reviews yet