
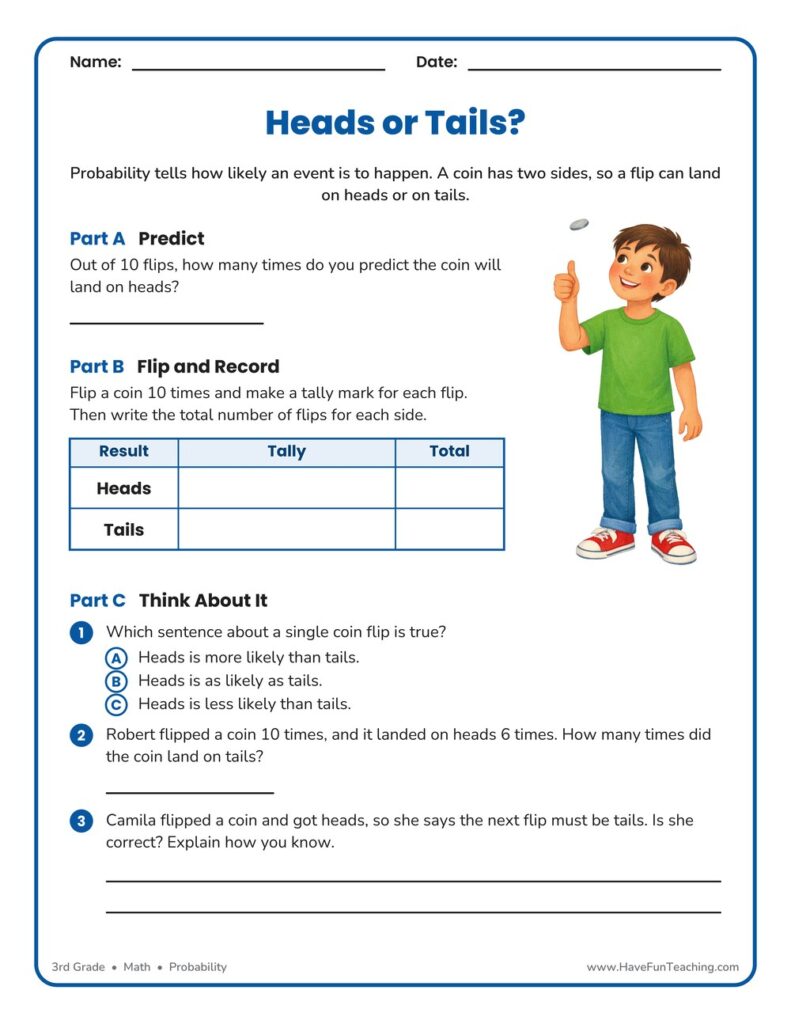
Heads or Tails Probability Worksheet
This Heads or Tails Probability Worksheet has 3rd graders predict, flip a coin ten times, and tally the results, then explain why each flip is equally likely. Answer key included.
$6.97
Or free with a membership — members pay $3.33/mo for all 10,000+ resources. See plans
Want this one free?
Tell us where to send it and it’s yours — no card, no catch.
One free resource per teacher. We’ll also send free teaching ideas each week — unsubscribe anytime.
Teaching is easier with a membership
Unlimited printables, games & videos for PreK–6th — for your classroom or homeschool. Cancel anytime.
Start your 3-day free trial$0 today · cancel anytime · Instant access to 10,000+ resources
About this resource
Description
Probability is the branch of math that describes how likely an event is to happen, and a coin flip is the clearest place for a young mathematician to meet it. A coin has exactly two sides, so heads and tails are equally likely on every single flip. This Heads or Tails Probability Worksheet gives third graders a hands-on way to see that idea for themselves. Students predict a result, run ten trials, record the outcomes in a tally chart, and then compare what they predicted with what actually happened.
Using this Heads or Tails Probability Worksheet, students begin by writing a prediction for how many of ten flips will land on heads. Then they flip a real coin ten times, make a tally mark for each flip, and total each row of the chart. Finally, they answer three reasoning questions that push past the experiment itself: identifying that heads and tails are equally likely, solving a word problem about a ten-flip trial, and explaining in writing why one flip never decides the next one. An answer key is included for the reasoning section, and the experiment section is marked as varying, because every child’s flips are their own.
What’s Included
- 1 print-ready PDF worksheet
- 1 answer key page
- A prediction prompt, a ten-flip tally chart, and three reasoning questions
This activity helps kids learn probability in three ways. First, it makes an abstract idea physical: the child holds the coin, so the randomness is something they cause rather than something they read about. Second, the tally chart builds real data-collection skills that carry straight into graphing and statistics later on. Third, the written explanation question asks students to defend their thinking, which is exactly the kind of constructed response third grade assessments ask for.
Teachers and parents can stretch this 3rd grade probability worksheet in several directions. Try running the experiment a second time and comparing the two sets of totals, or pool the whole class’s results on the board so students can watch the totals move closer to five and five as the number of trials grows. You can also swap the coin for a two-color counter, a spinner with two equal parts, or a paper cup that lands up or down, then ask which of those are still fair.
Related Resources
What teachers say
Reviews
You must be logged in to post a review.
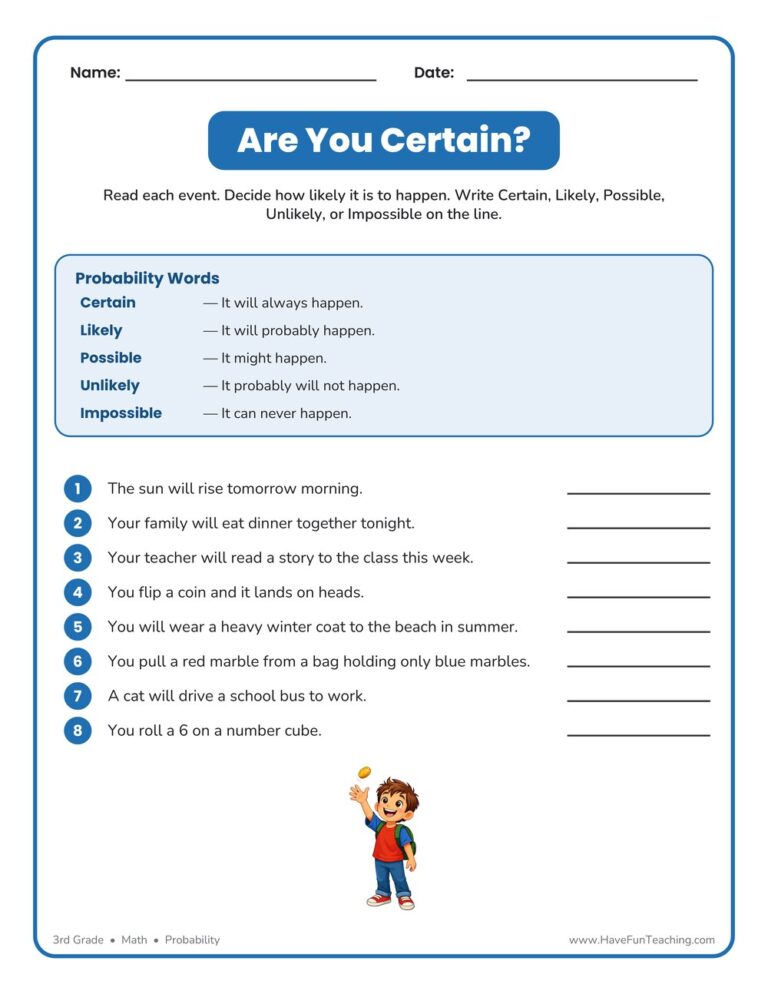
The Are You Certain? Probability Worksheet gives 3rd graders playful, real-world practice deciding whether everyday events are certain, likely, possible, unlikely, or impossible. Includes a complete answer key for fast, no-prep probability review.
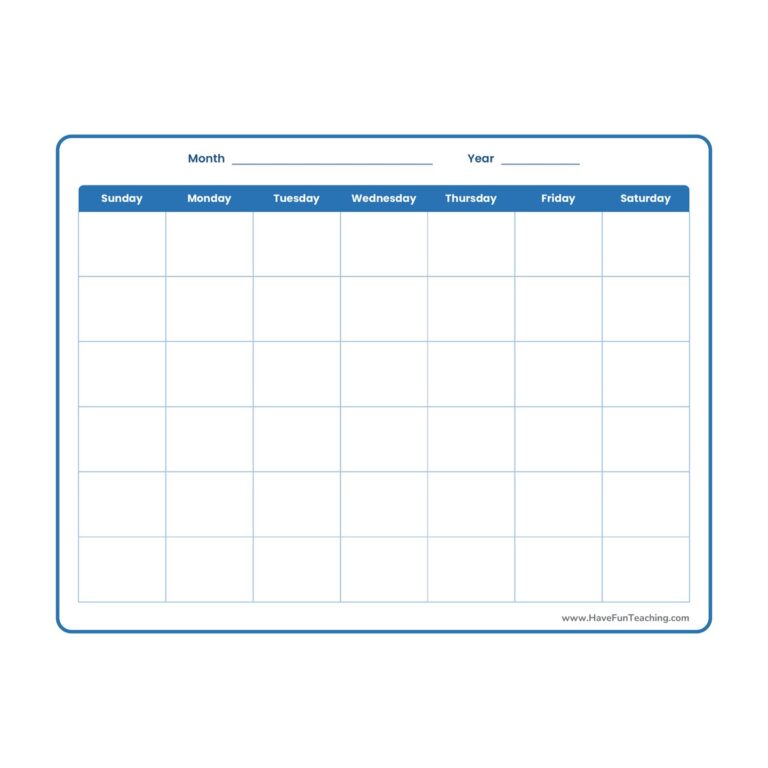
A printable, ready-to-use blank calendar with a landscape monthly grid and labeled day columns. Great for Kindergarten through 5th grade classrooms to map out lessons, holidays, and daily routines—just add the month and the dates.
Using the Counting Songs (Classic Video Collection), students practice skip counting by all of the numbers by singing and counting along to these thirteen videos.
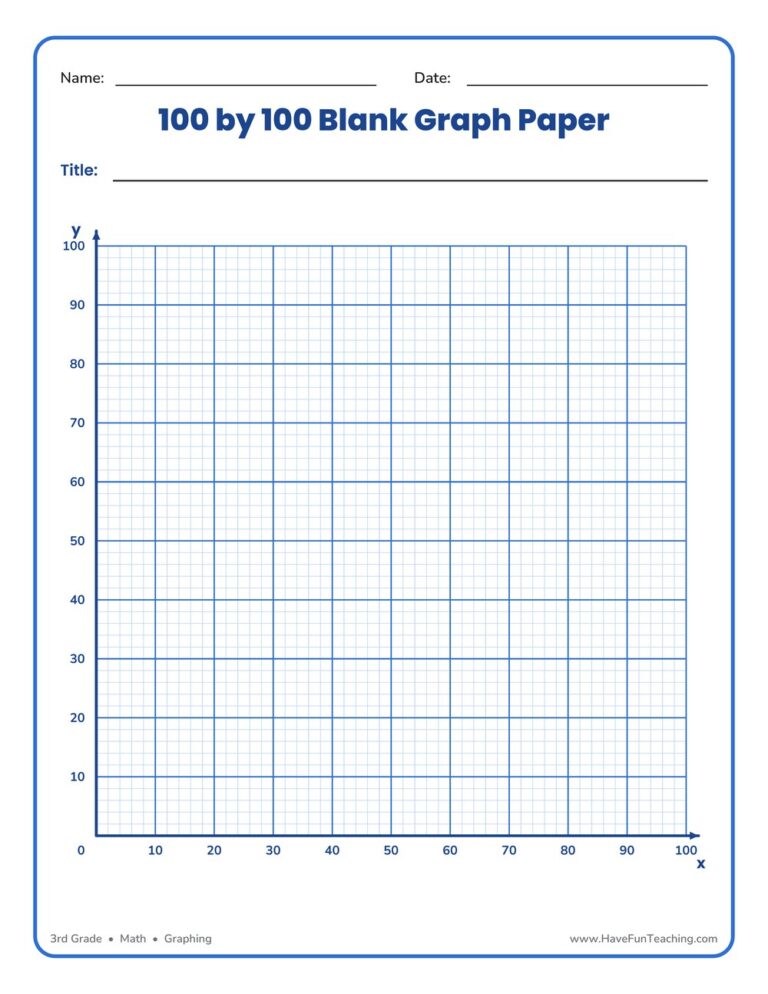
This 100 by 100 blank graph paper worksheet gives 3rd graders a ready-made coordinate grid numbered to 100 by tens — perfect for plotting points, building bar graphs, and organizing data with no prep required.
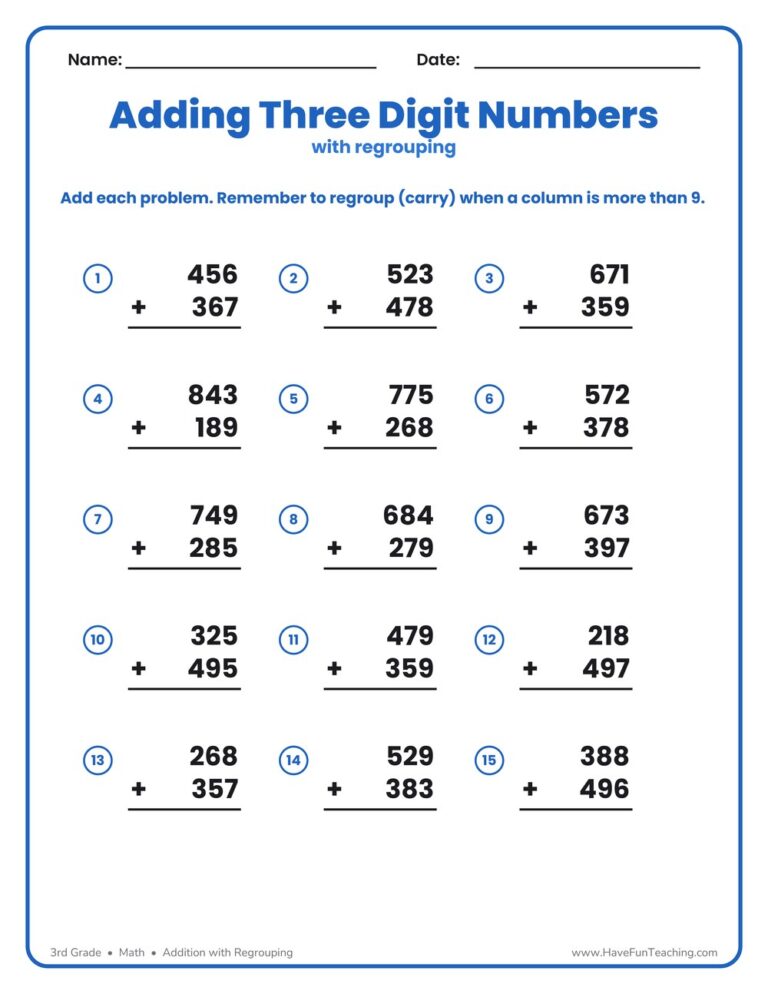
This triple digit addition regrouping worksheet gives 3rd graders fifteen three-digit column addition problems that all practice carrying across places. A complete answer key is included for fast, no-prep math review.

This Third Grade Math Test Practice Worksheet gives students 10 multiple-choice questions on place value, addition, and subtraction, with a complete answer key for fast, no-prep review.
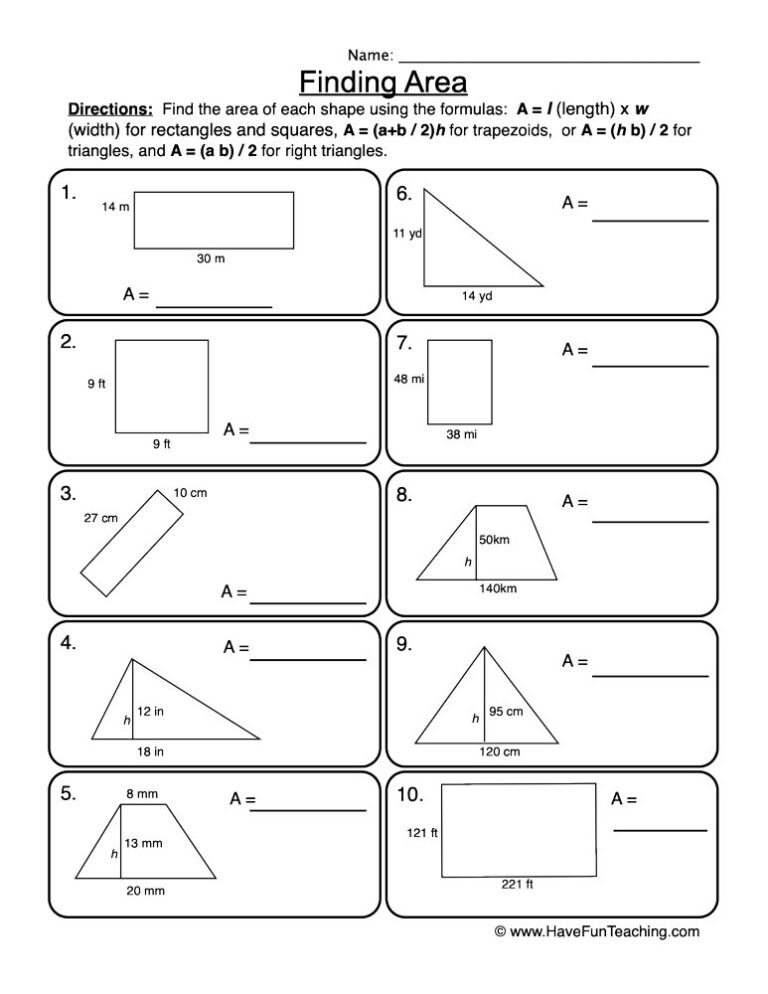
A Finding Different Shapes Area Worksheet where 3rd graders find the area of rectangles, squares, and composite shapes in square units. Answer key included—great for no-prep area practice.

Third graders round three-digit numbers to the nearest hundred to estimate each sum on this Adding and Estimation Worksheet, then add to find the actual total. Includes an answer key—great for quick, no-prep math practice.

This 3rd grade Finding the Area of Grid Shapes Worksheet has students count unit squares to find the area of rectangles and L-shapes. Answer key included.

Using the Counting By Fives Song (Original Music Video), students practice skip counting by 5s by singing and counting along to this fun and engaging video!
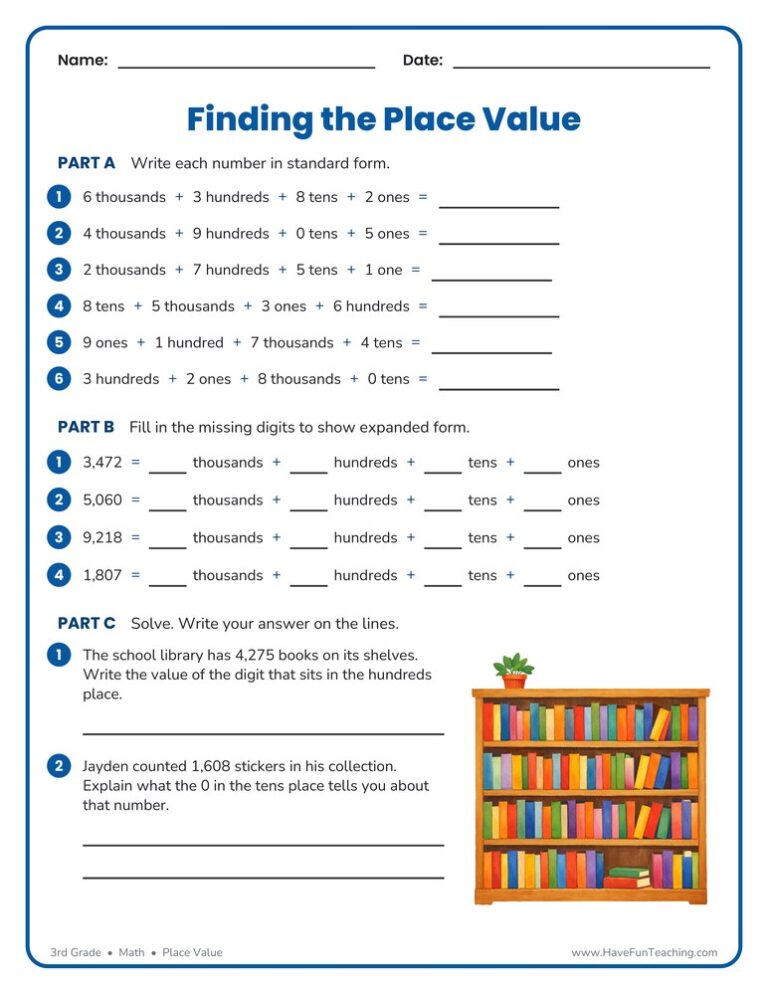
This Place Value Thousands, Hundreds, Tens, Ones Worksheet gives 3rd Grade students practice moving between expanded form and standard form, with an answer key included, so four-digit numbers finally click.

This third grade multiplication and division test practice worksheet gives students twelve multiple-choice problems that mix facts with word problems. Includes a complete answer key — perfect for quick, no-prep review before a quiz or test.




Reviews
There are no reviews yet