
3 days free
Ready for the whole library?
You’ve had your freebie — but members download 10,000+ resources for every grade, all year long. Try it free — $0 today, cancel anytime.
Free for teachers
Pick your grade. We’ll send 10 free resources.
Worksheets, activities and a video — picked for your classroom, ready to print tonight.
One free bundle per teacher. We’ll also send free teaching ideas each week — unsubscribe anytime.

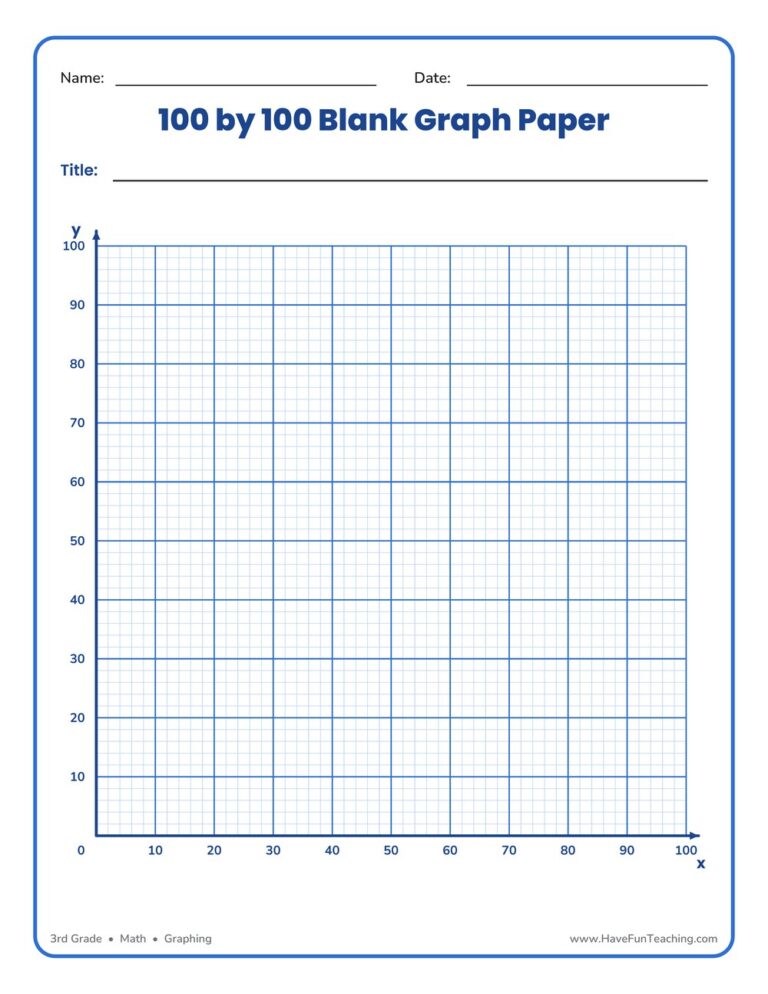
This 100 by 100 blank graph paper worksheet gives 3rd graders a ready-made coordinate grid numbered to 100 by tens — perfect for plotting points, building bar graphs, and organizing data with no prep required.
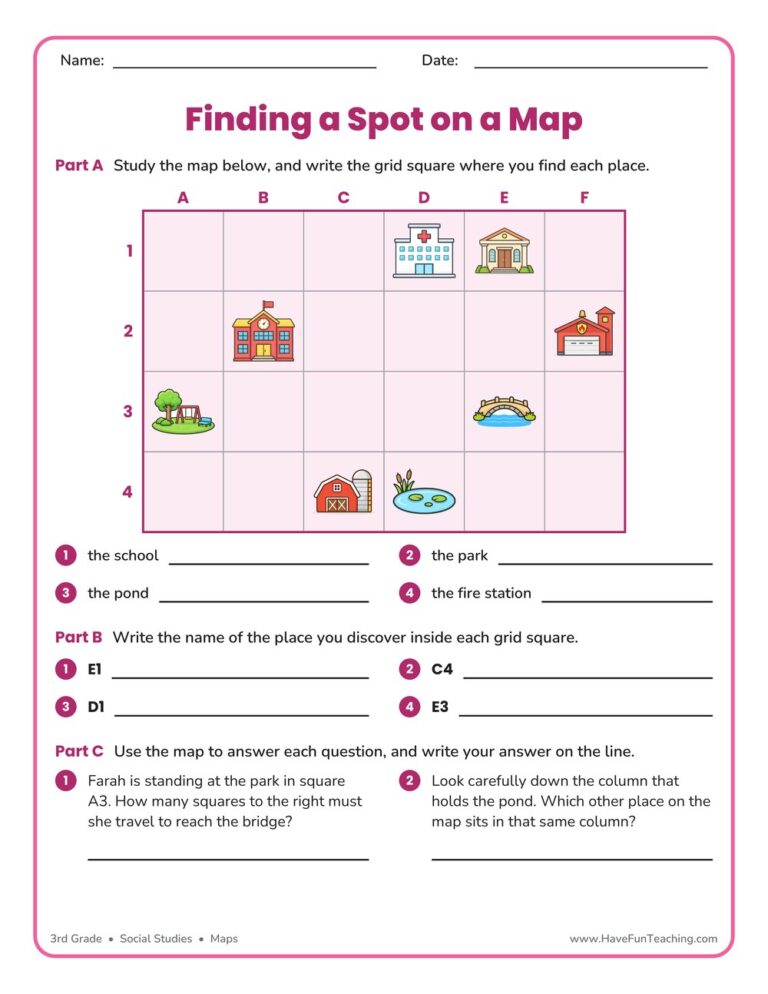
A finding a spot on a map worksheet for 3rd grade, built on one labeled town grid with place-to-square, square-to-place, and reasoning questions. Answer key included for quick no-prep map skills practice.

This making a graph using data worksheet has 3rd graders build a scaled bar graph from an orchard data table, then answer four questions about it. An answer key is included, so graphing practice needs no prep.

Students build a scaled bar graph from a class food survey in this Thanksgiving Graph Worksheet, then answer comparison questions about the data. Written for 3rd Grade, with an answer key included for fast checking.
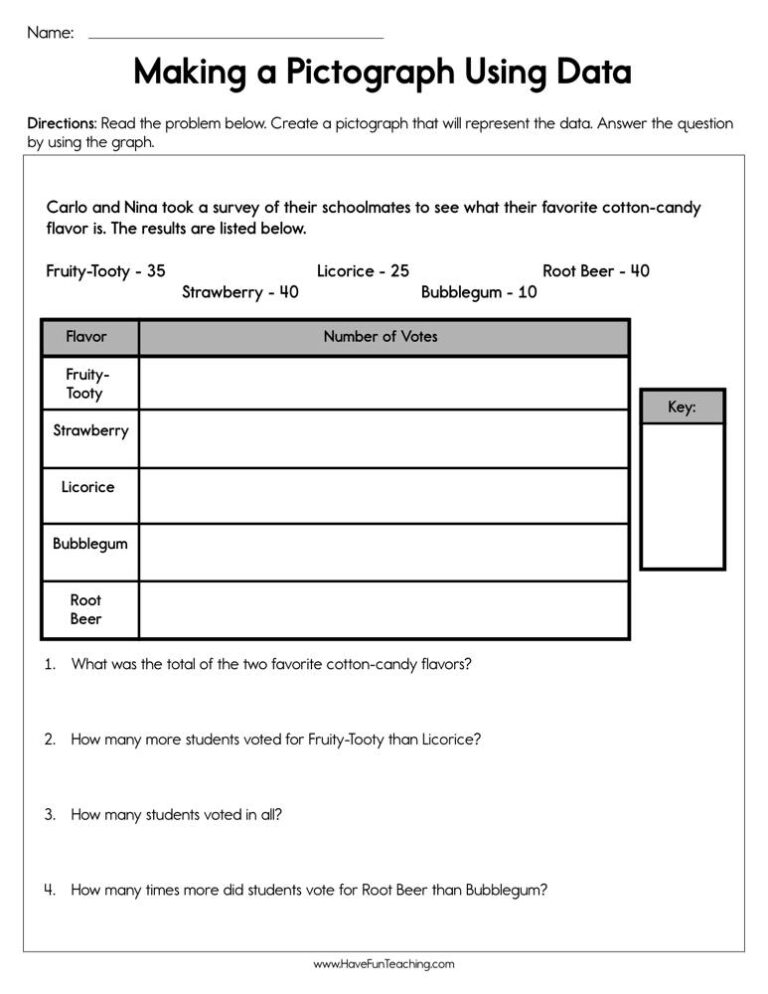
A Making a Pictograph Using Data Worksheet for 3rd Grade: students draw one star for every five votes, then read, compare, and explain their graph. Answer key included for easy, no-prep graphing practice.

This Multiplication Bar Graphs Worksheet has 3rd grade students solve six multiplication problems and graph each product on a scaled bar graph. An answer key is included, so checking work takes seconds.

A blank pie graph worksheet where 3rd graders collect their own data, color the circle sections, and label a key. A reusable, no-prep template for hands-on graphing practice at home or school.

This organizing data using a bar graph worksheet has 3rd Grade students turn a data table into a scaled bar graph, then answer read, compare and two-step questions. An answer key is included.

Using this Graphing Measurements Worksheet, students measure the objects below to create a line graph that shows growth over time.
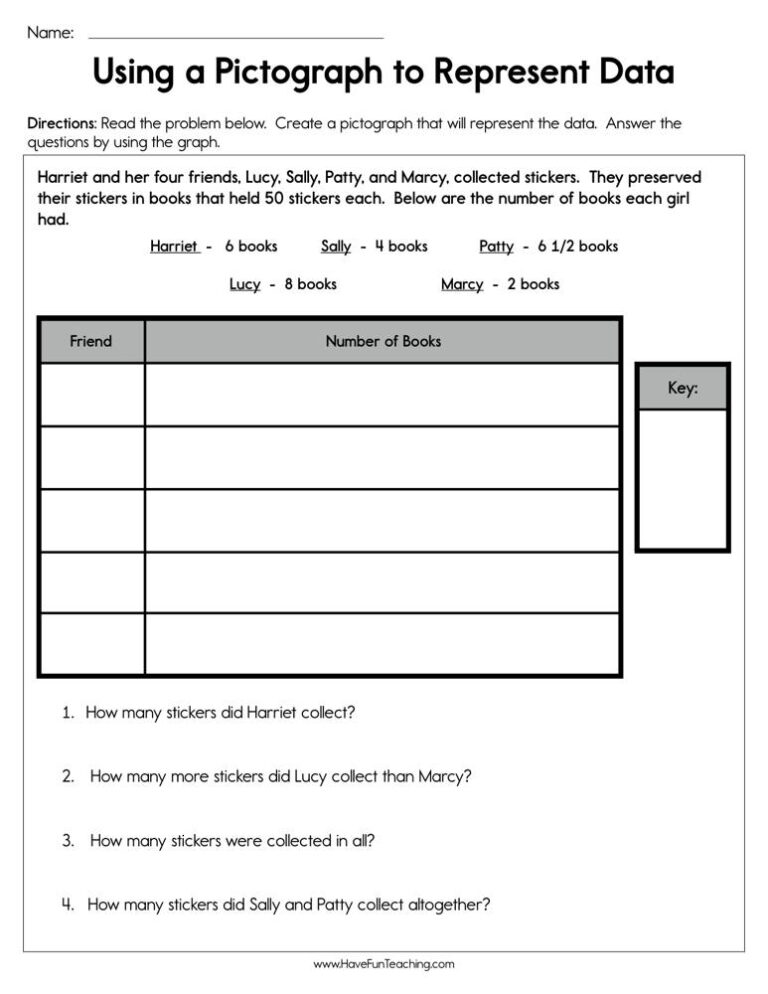
This using a pictograph to represent data worksheet has 3rd Grade students draw a scaled star graph, with half stars, from a sticker table. Answer key included for easy checking.

This graphing favorite foods worksheet has 3rd graders draw a scaled bar graph from lunch vote data, then answer comparison and two-step questions. An answer key is included for fast checking.
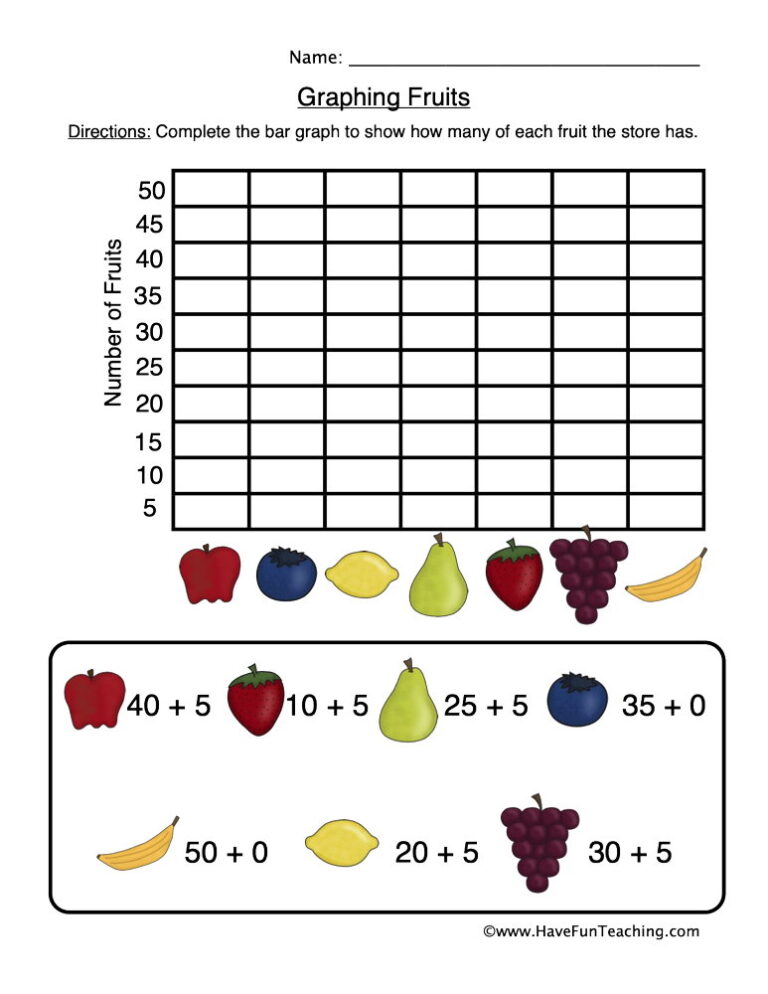
The Graphing Fruits Worksheet has 2nd grade students solve four addition facts, color a bar graph with their answers and read it to answer three questions, with a full answer key.
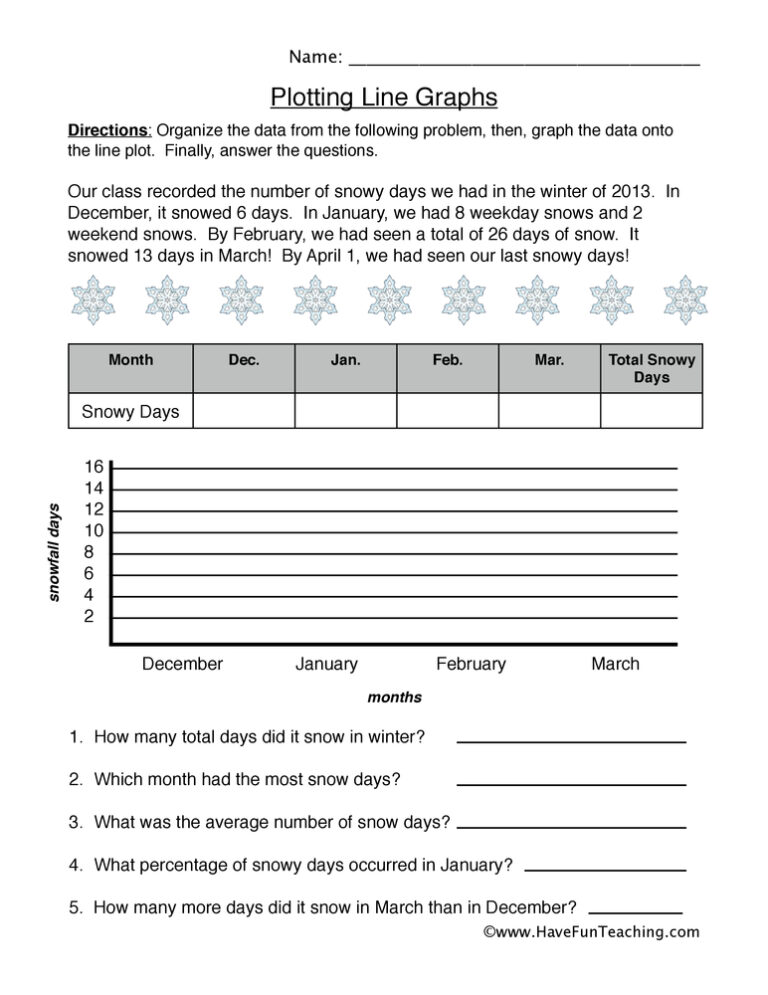
Using this Plotting Line Graph Worksheet, students analyze the number of snowy days in a line graph.

The Memorial Day Graphing Worksheet has 3rd Grade students skip count by twos, color a scaled bar graph, and answer four questions about it, with a full answer key so checking the work takes a minute.
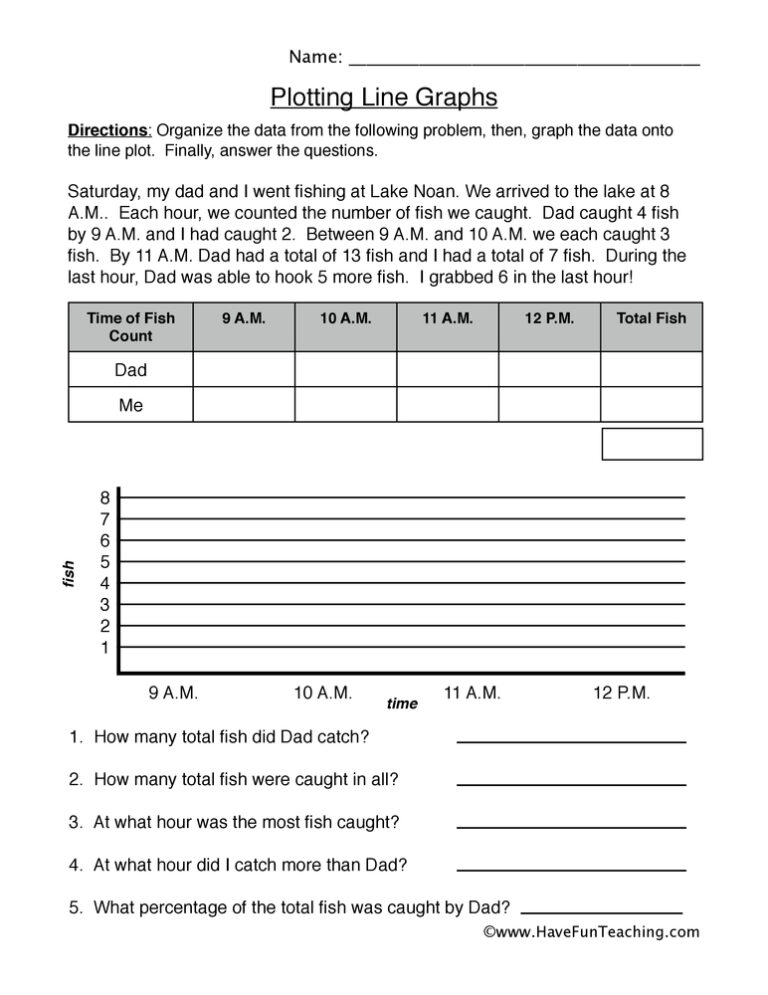
Using this Plotting Line Graphs Worksheet, students analyze the number of fish caught in a line graph.

This Measurement Data on a Line Plot Worksheet has 3rd grade students plot sixteen half-inch ribbon measurements, then answer five questions about their own data; an answer key is included, so graphing practice is ready to hand out.

Using this Gathering Information from a Graph Worksheet, students answer questions about balloons for a party using the data from the graph.

Using this Graphing School Objects Worksheet, students count the number of objects in their own classroom and then record it on a bar graph.

Using this Graphing Bugs Worksheet, students analyze the number of bugs at the zoo in a bar graph.

Using this Organizing Measurements Worksheet, students organize the measurements listed below into a line plot by using an X to mark the data.



