

Pet Day Data Worksheet
The Pet Day Data Worksheet has 3rd grade students read a bar graph where each square is five pets, then compare, add and solve two-step questions. An answer key is included for easy checking.
$6.97
Want this one free?
Tell us where to send it and it’s yours — no card, no catch.
One free resource per teacher. We’ll also send free teaching ideas each week — unsubscribe anytime.
Free teacher account · no credit card
Membership
Get every game, song, & printable
- Every game, on any device
- 6,600+ resources
- Assign online with HFT Classroom
Then $39.97/year · cancel anytime · See plans
- Instant digital download
- Printable PDF + answer key
- Made by real teachers
Teacher / Family membership
Teaching is easier with every resource
One membership for your whole year: 6,600+ worksheets, games, songs and videos for Preschool–6th, for your classroom or homeschool.
- Unlimited printables & downloads
- Every game, on any device
- Assign online with HFT Classroom
- Cancel anytime
Teacher / Family membership · 3 days free
Yearly
Monthly would be $119.64 a year
$3.33/month
Billed $39.97 once a year
You save $79.67 every year
Start My 3 Free Days$0 today · cancel anytime
Monthly
$9.97/month
Flexible, month to month
Yearly is just $3.33/mo. Switch and save $79.67
Start My 3 Free Days$0 today · cancel anytime
About this resource
Description
How to Teach Reading a Scaled Bar Graph
This Pet Day Data Worksheet helps 3rd grade students read a scaled bar graph, where each square stands for more than one item. On Pet Day, every child brought one pet from home, and the bar graph shows how many cats, hamsters, fish, dogs and birds came to school. Students learn to count by fives up each bar, compare the bars, and solve one-step and two-step problems using the data, just as the Common Core standard for picture and bar graphs asks.
Using the Pet Day Data Worksheet
Start by pointing out the graph’s scale: each square stands for 5 pets. Students read the height of each bar by skip counting, then answer questions about the most and fewest pets, how many more of one animal came than another, and the total number of animals. The last question shows a common mistake, where a student counts one square as one pet, and asks children to explain what went wrong. This 3rd grade bar graph worksheet works well for whole-class practice, centers, homework or a quick check.
What’s Included
- A coded bar graph of five pets with a scale of 5
- Seven questions to read, compare, add and solve two-step problems
- One written explanation of a scale mistake
- A complete answer key
Why This Worksheet Helps Kids
First, reading a scale of 5 builds skip counting and multiplication sense at the same time. Second, the compare and two-step questions move students beyond simply reading a bar to actually using the data. Third, explaining the scale mistake helps students notice and fix the most common bar graph error on tests.
Ideas for Teachers and Parents
Before the Pet Day Data Worksheet, take a quick class survey of favorite pets and tally the results together. After the worksheet, have students make their own bar graph with a scale of 2 or 10 and write two questions for a partner. Parents can graph the pets in their neighborhood or the colors of cars on a short walk.
Related Resources
What teachers say
Reviews
Write a review, earn store credit
Get 25¢ in credit for every approved review of a resource you’ve downloaded, played or purchased — up to 15 a month. Credit applies automatically to your membership payments, so your reviews can help pay for your membership.
Honest reviews only — any star rating earns the same. Program rules
Log in to write a review and earn store credit.
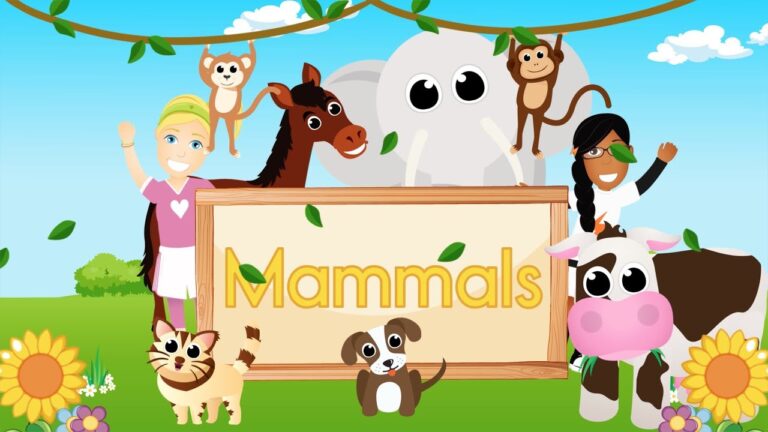
The Mammal Song by Have Fun Teaching is perfect for teaching and learning all about mammals. This animated music video teaches that mammals breathe air with lungs, are warm-blooded, have fur or hair, give birth to live young and feed their babies milk. While watching the Mammal Song, students learn…
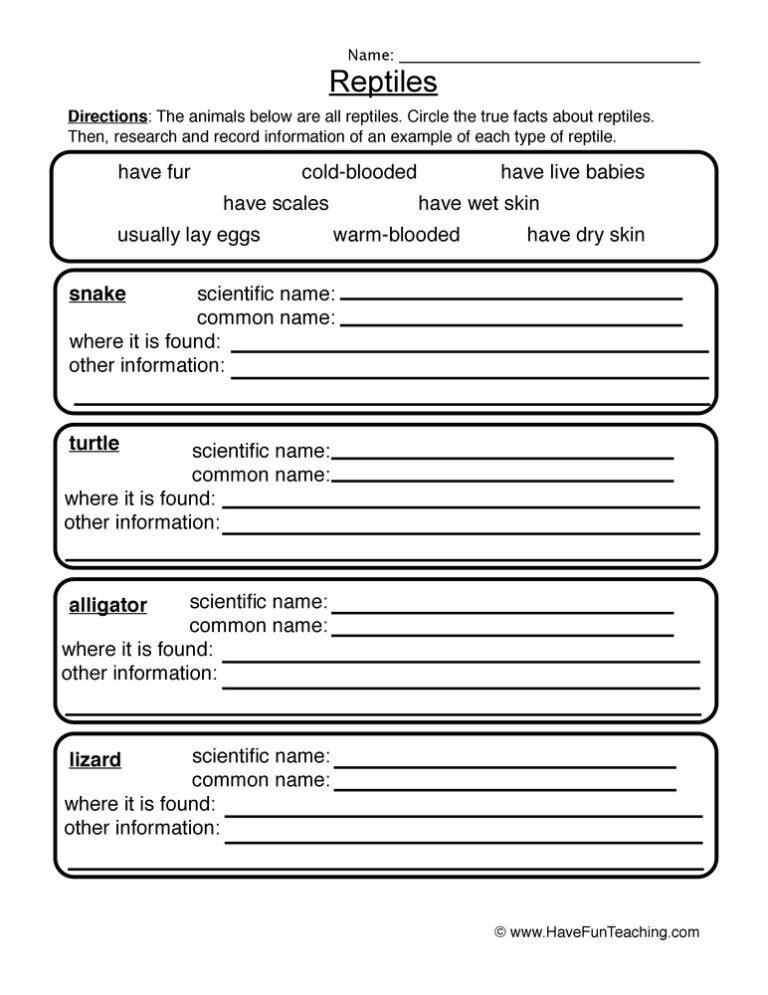
This reptiles worksheet has 3rd Grade students check reptile facts, sort eight animals into reptile and not-a-reptile columns, and explain how a frog differs. An answer key is included, so checking work takes seconds.

This animal habitats worksheet asks 3rd Grade students to match animals to their habitats, sort six animals into two environments, and explain one desert adaptation. An answer key is included for fast, no-prep science practice.

Using this Animal Song (Animated Music Video), your students learn about different types of animals and their sounds by watching this fun, catchy video.
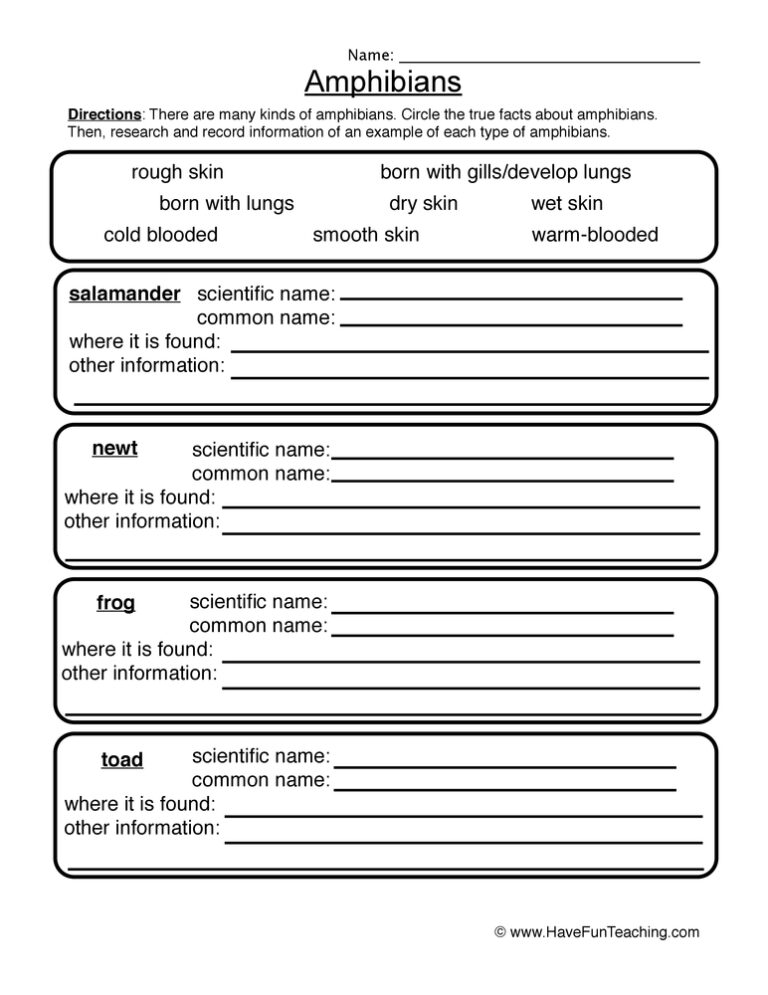
This amphibians worksheet has 3rd graders circle amphibian traits, sort eight animals into amphibian and non-amphibian columns, and explain their thinking. Answer key included for fast, no-prep science practice.

This drawing fossils worksheet has 3rd graders sketch the imprint a fern leaf, seashell, fish and bird foot would leave in rock, then answer three written questions. Answer key included.

This bird classification worksheet asks 3rd grade students to sort eight animals into birds and not birds, then match four trait clues. A full answer key makes the sort quick to check.
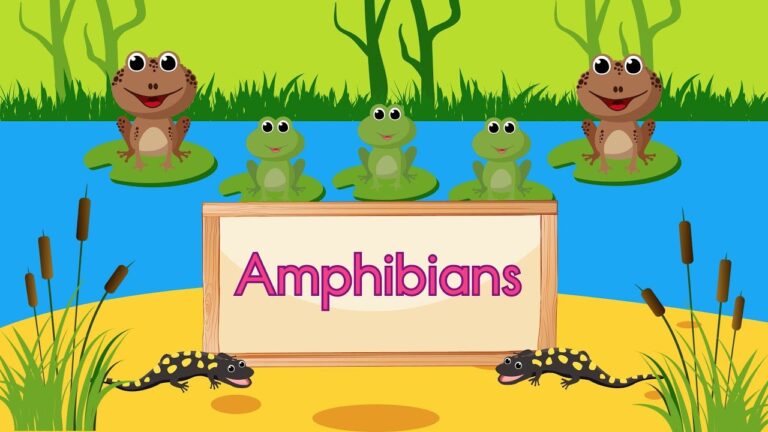
The Amphibian Song by Have Fun Teaching is perfect for teaching and learning all about amphibians. This animated music video teaches that amphibians live on land and in water, start life with gills, go through metamorphosis and have moist skin without scales. While watching the Amphibian Song, students learn the…
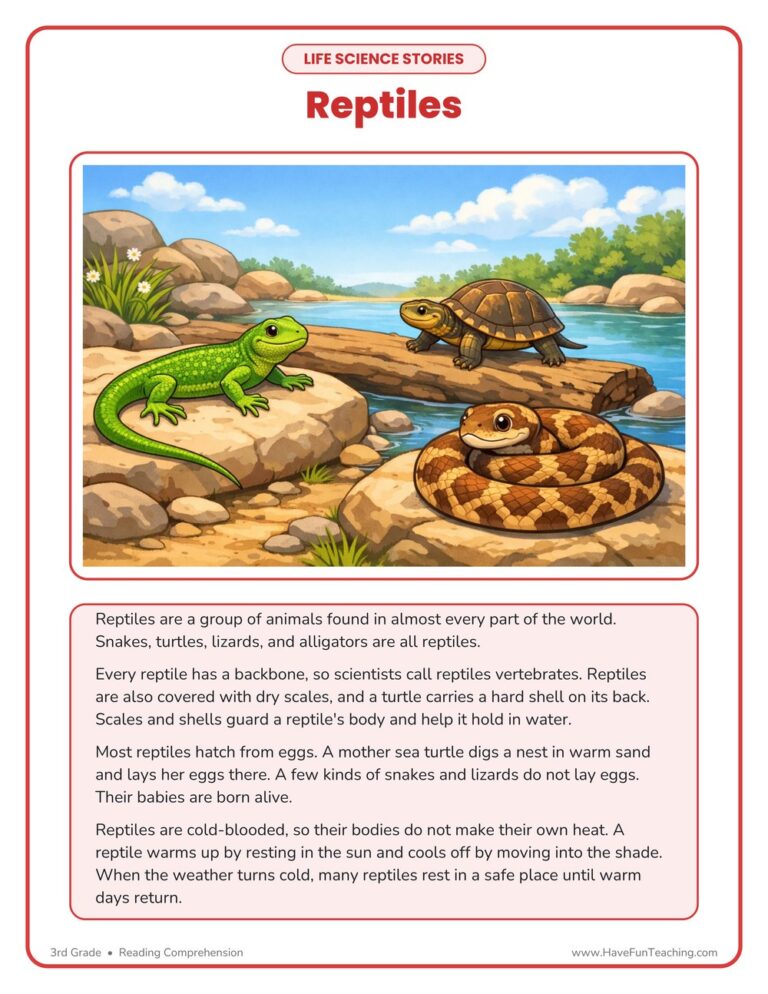
Build non-fiction reading skills with the Reptiles Life Science Reading Comprehension Worksheet, a 3rd grade passage about reptiles with comprehension questions and an answer key included. Reading and science practice in one page.
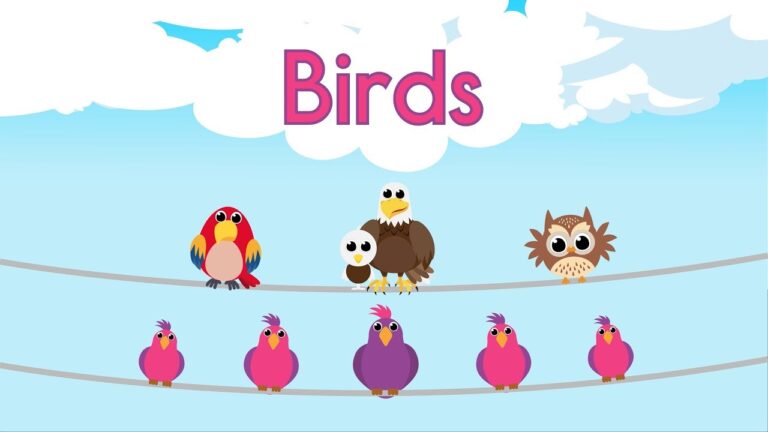
The Bird Song by Have Fun Teaching is perfect for teaching and learning all about birds. This animated music video teaches that birds have beaks but no teeth, walk on two feet, lay eggs, are warm-blooded, have backbones and are covered with feathers. While watching the Bird Song, students learn…

This animals matching classification worksheet has 3rd grade students sort twelve animals into mammals, birds, reptiles, amphibians, fish, and insects, then solve clue questions. An answer key is included for quick checking.
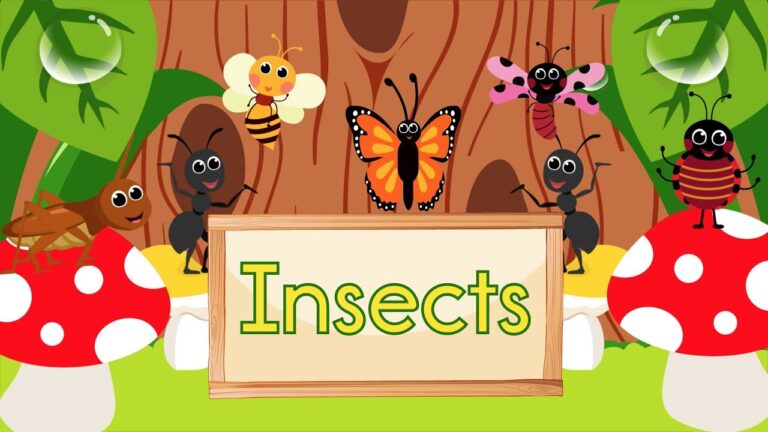
The Insect Song by Have Fun Teaching is perfect for teaching and learning all about insects. This animated music video teaches what makes an insect an insect: an exoskeleton, three body parts (head, thorax and abdomen), six legs and two antennae. While watching the Insect Song, students learn the traits…
Reviews
There are no reviews yet