

2.MD.10 Second Grade Common Core Lesson
In this 2.MD.10 Second Grade Common Core Lesson, students draw a picture graph and a bar graph and analyze given graph.
$6.97
Want this one free?
Tell us where to send it and it’s yours — no card, no catch.
One free resource per teacher. We’ll also send free teaching ideas each week — unsubscribe anytime.
Free teacher account · no credit card
Membership
Get every game, song, & printable
- Every game, on any device
- 6,500+ resources
- Assign online with HFT Classroom
Then $39.97/year · cancel anytime · See plans
- Instant digital download
- Printable PDF + answer key
- Made by real teachers
Teacher / Family membership
Teaching is easier with every resource
One membership for your whole year: 6,500+ worksheets, games, songs and videos for Preschool–6th, for your classroom or homeschool.
- Unlimited printables & downloads
- Every game, on any device
- Assign online with HFT Classroom
- Cancel anytime
Teacher / Family membership · 3 days free
Yearly
Monthly would be $119.64 a year
$3.33/month
Billed $39.97 once a year
You save $79.67 every year
Start My 3 Free Days$0 today · cancel anytime
Monthly
$9.97/month
Flexible, month to month
Yearly is just $3.33/mo. Switch and save $79.67
Start My 3 Free Days$0 today · cancel anytime
About this resource
Description
How to teach Graphing
In this 2.MD.10 Second Grade Common Core Lesson, students draw a picture graph and a bar graph and analyze given graph.
Your students need to know how to collect and analyze data on a graph. This lesson is perfect for small group, math centers, independent practice or whole group lesson.
Students survey classmates to find out their favorite fruits. Then, they create a bar graph to display their data and answer questions.
Other resources to use with this 2.MD.10 Second Grade Common Core Lesson
If you are using this lesson, your students are probably learning about graphing.
Use this Summer Graphing Activity as an additional resource for your students.
You may introduce this lesson by displaying a some data to your class (Blue- 4, Green-3, and Red-2) and asking how we could show this data. Get suggestions from 2-3 students. Then, distribute the picture graph worksheet so students can collect data about their classmate’s favorite fruits. Next, support students as they use their picture graph to create a bar graph. Finally, students work independently or with a partner to analyze the bar graph by answering specific questions.
Be sure to check out more Graphing Activities and the entire Second Grade Common Core Workbook.
Please write a review!
Tell others why you love this resource and how you will use it.
What teachers say
Reviews
Write a review, earn store credit
Get 25¢ in credit for every approved review of a resource you’ve downloaded, played or purchased — up to 15 a month. Credit applies automatically to your membership payments, so your reviews can help pay for your membership.
Honest reviews only — any star rating earns the same. Program rules
Log in to write a review and earn store credit.
This printable 20 by 20 Blank Graph Paper Worksheet gives 2nd graders a clean 20 by 20 grid for bar graphs, plotting points, and organizing data. A versatile, no-prep template for any math lesson.

Give 2nd Grade graphers an open grid: this 10 by 10 blank graph paper worksheet has 100 equal squares plus lines for the graph title and both labels. Ready for any survey, tally, or weather log.

This making a graph using data worksheet has 3rd graders build a scaled bar graph from an orchard data table, then answer four questions about it. An answer key is included, so graphing practice needs no prep.

This graphing sports worksheet has 2nd Grade students count sports balls, color a bar graph from their own data, and answer three questions about it. An answer key is included.
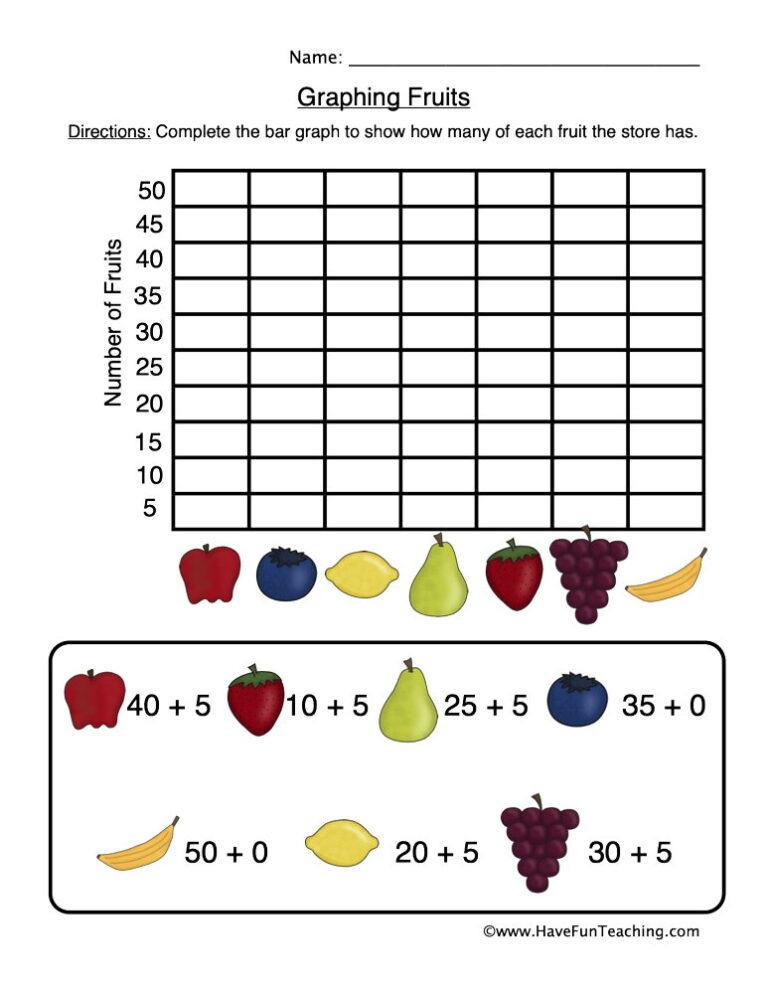
The Graphing Fruits Worksheet has 2nd grade students solve four addition facts, color a bar graph with their answers and read it to answer three questions, with a full answer key.

An animals bar graph worksheet for 2nd grade: students color one box per animal to build a four-category bar graph, then compare and add using it. Answer key included, so checking data work takes seconds.
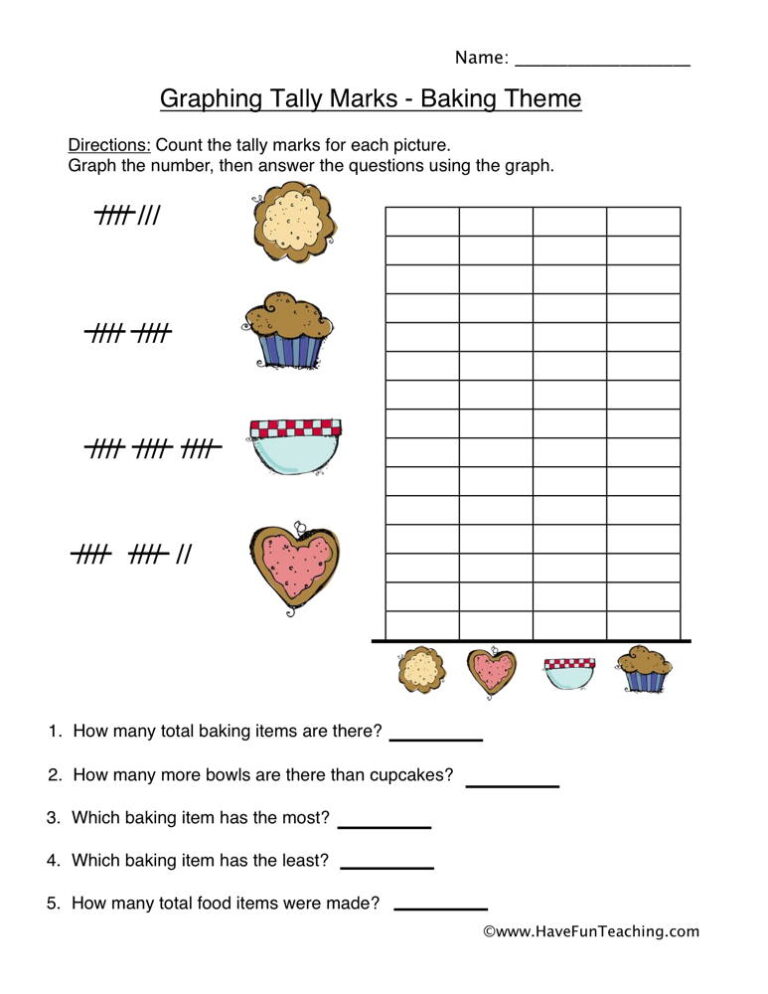
This baking graphing tally marks worksheet has 2nd graders count four sets of tally marks and color a bar graph, then answer four questions. An answer key is included, so checking takes a minute.

This summer graphing activity has children spin, tally and color a bar graph. Made for Kindergarten to 2nd Grade, with a practice page and answer key included.
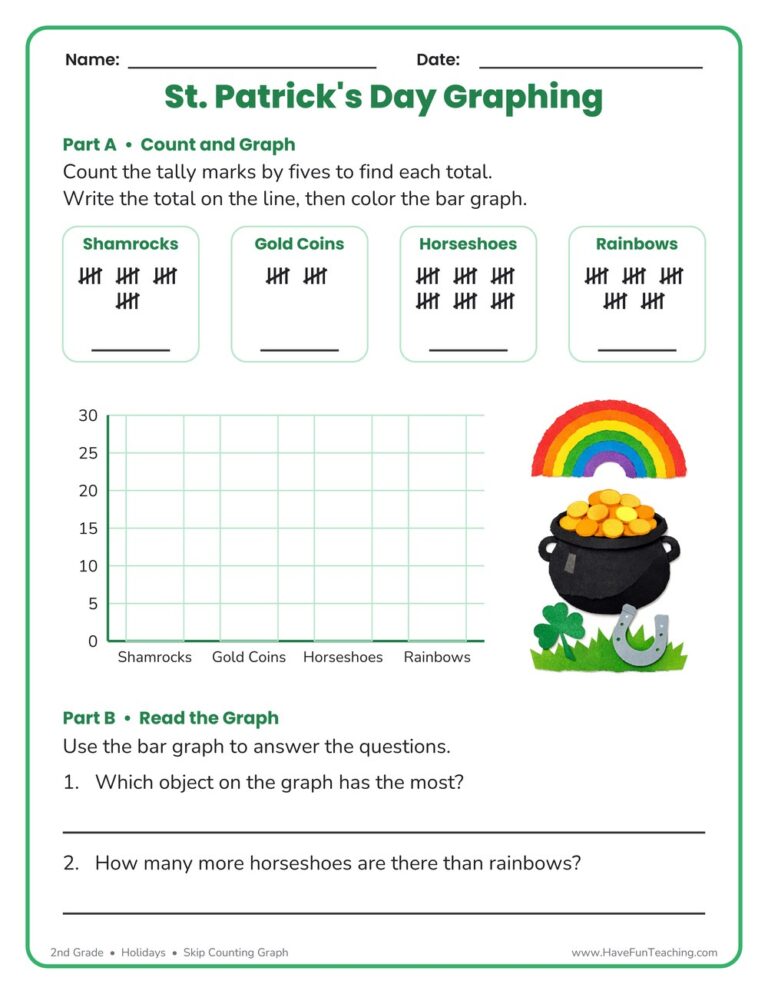
This St. Patrick's Day Skip Counting Graph Worksheet has 2nd Grade students count tally marks by fives, write each total, and color the bar graph. Answer key included, so checking takes seconds.
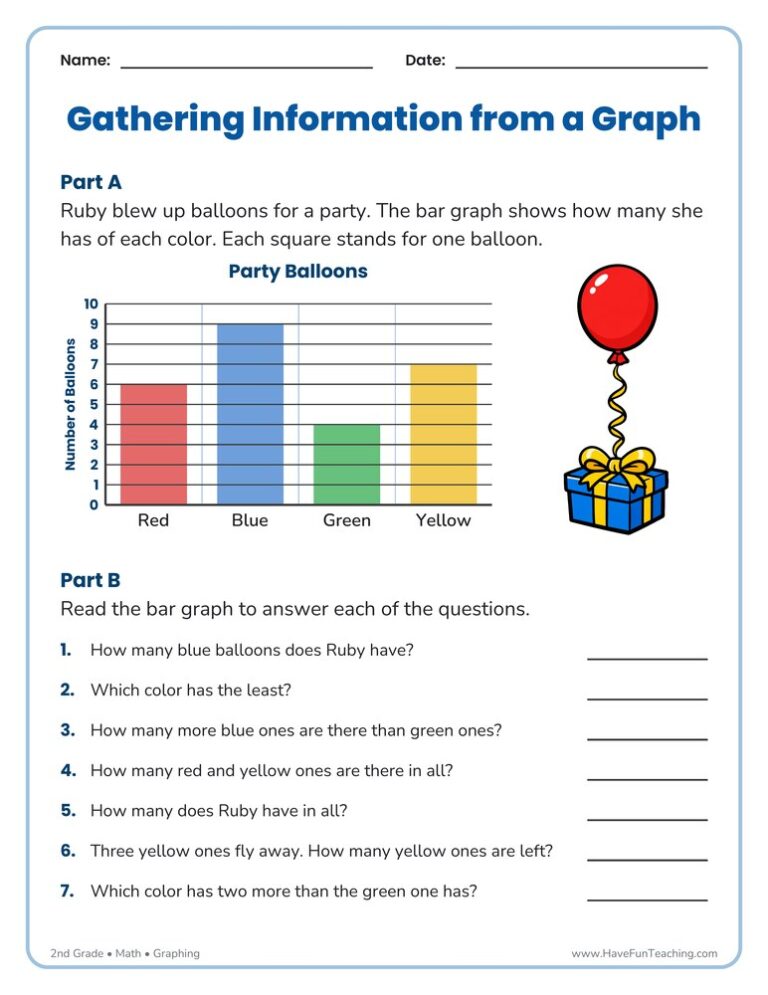
This gathering information from a graph worksheet has 2nd Grade students read a party balloon bar graph and solve seven compare, add, and subtract questions. An answer key is included for quick checking.

This back to school graph worksheet has 2nd graders count a box of school supplies, color a bar graph from their own data, and answer three questions about it. Answer key included for fast, no-prep checking.

A Valentine's Day Candy Heart Graph Worksheet where 2nd graders count tally marks, color a bar graph of four candy colors, and answer four questions about their data. Answer key included for fast, no-prep graphing practice.
Reviews
There are no reviews yet