
3 days free
Ready for the whole library?
You’ve had your freebie — but members download 10,000+ resources for every grade, all year long. Try it free — $0 today, cancel anytime.
Free for teachers
Pick your grade. We’ll send 10 free resources.
Worksheets, activities and a video — picked for your classroom, ready to print tonight.
One free bundle per teacher. We’ll also send free teaching ideas each week — unsubscribe anytime.




This making a graph using data worksheet has 3rd graders build a scaled bar graph from an orchard data table, then answer four questions about it. An answer key is included, so graphing practice needs no prep.
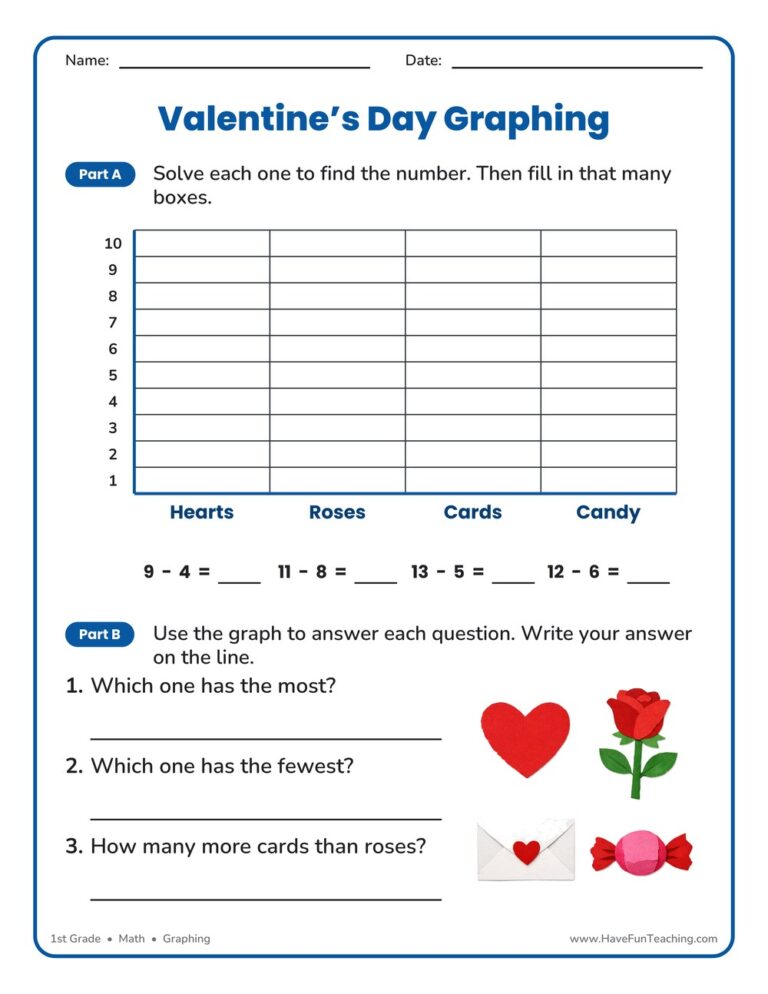
This Valentine's Day Graphing Worksheet has 1st Grade students solve four subtraction facts, fill in a bar for each answer, and read the graph they built. Answer key included, so checking takes seconds.
Using this Bar Graph Activity, students practice using data to create and analyze a bar graph.
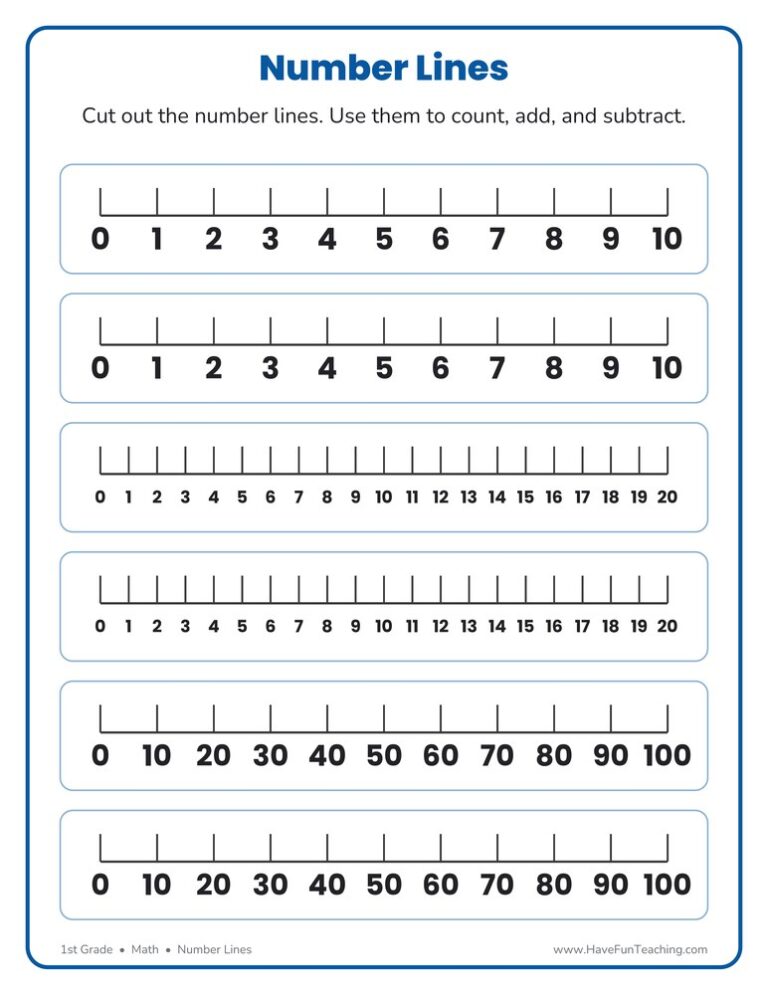
This number lines template worksheet prints six cut-out number lines for 1st grade: two to 10, two to 20, and two counting by tens to 100. Hand one to every student for counting, adding, and subtracting.
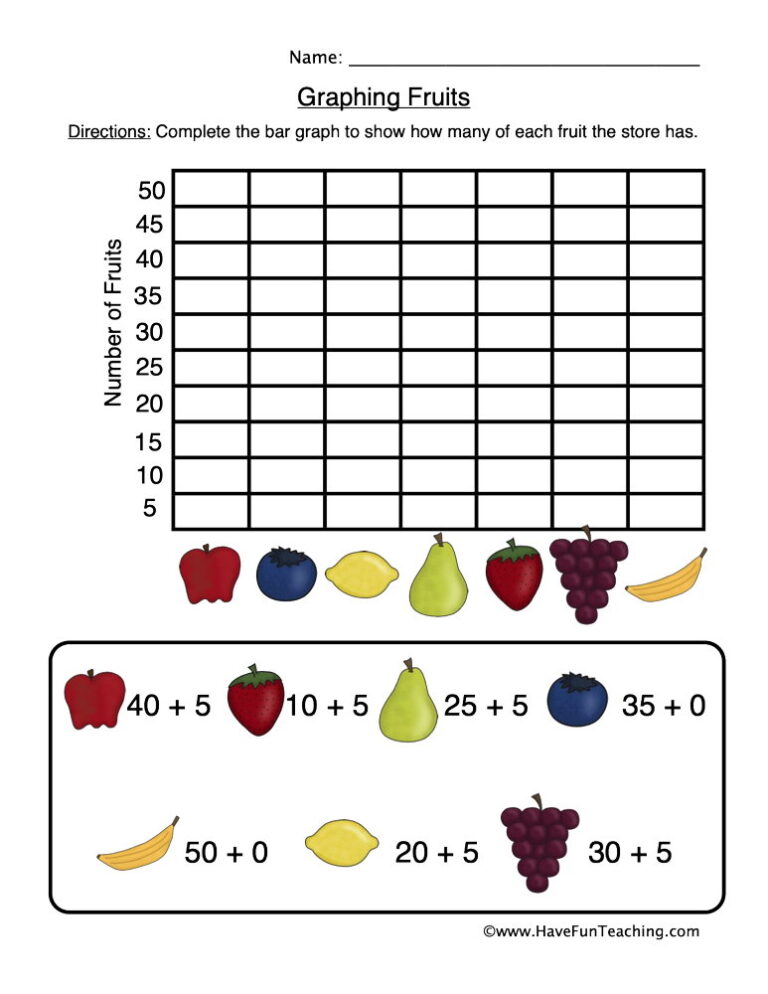
The Graphing Fruits Worksheet has 2nd grade students solve four addition facts, color a bar graph with their answers and read it to answer three questions, with a full answer key.

Using this Summer Graphing Activity, students use the summer spinner to tally what you spin by graphing results.

This Christmas cookies counting tally marks worksheet helps 1st grade students count holiday cookies, draw tally marks and read tally groups by fives. An answer key is included for quick, confident checking.

Using this Sort Count Graph Activity, students count the amount of fruits and vegetables to record them on a graph.

This graphing school tools worksheet has 1st graders count 18 backpacks, markers and rulers, color a bar graph from their own count, and answer three questions about it. Answer key included for fast, no-prep data practice.

Using this Gathering Information from a Graph Worksheet, students answer questions about balloons for a party using the data from the graph.

Using this Graphing Bugs Worksheet, students analyze the number of bugs at the zoo in a bar graph.

Using this Using a Graph to Gather Information Worksheet, students answer the questions about the farm animals using the data in the graph.
Using this 1.MD.4 First Grade Common Core Lesson, students count the amount of fruits and vegetables to record them on a graph.
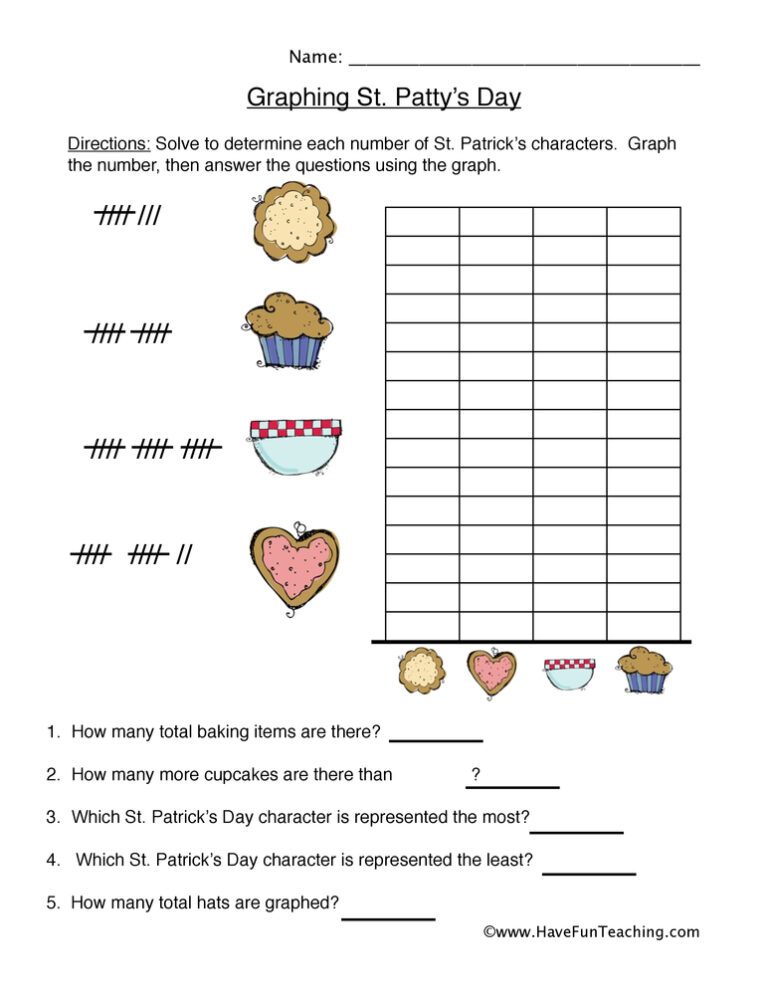
Using this Fundraiser Graphing Worksheet, students analyze the amount of money raised for a field trip fundraiser in a bar graph.

Using this Graphing Worksheet - Animals, students analyze a pie chart about animals.
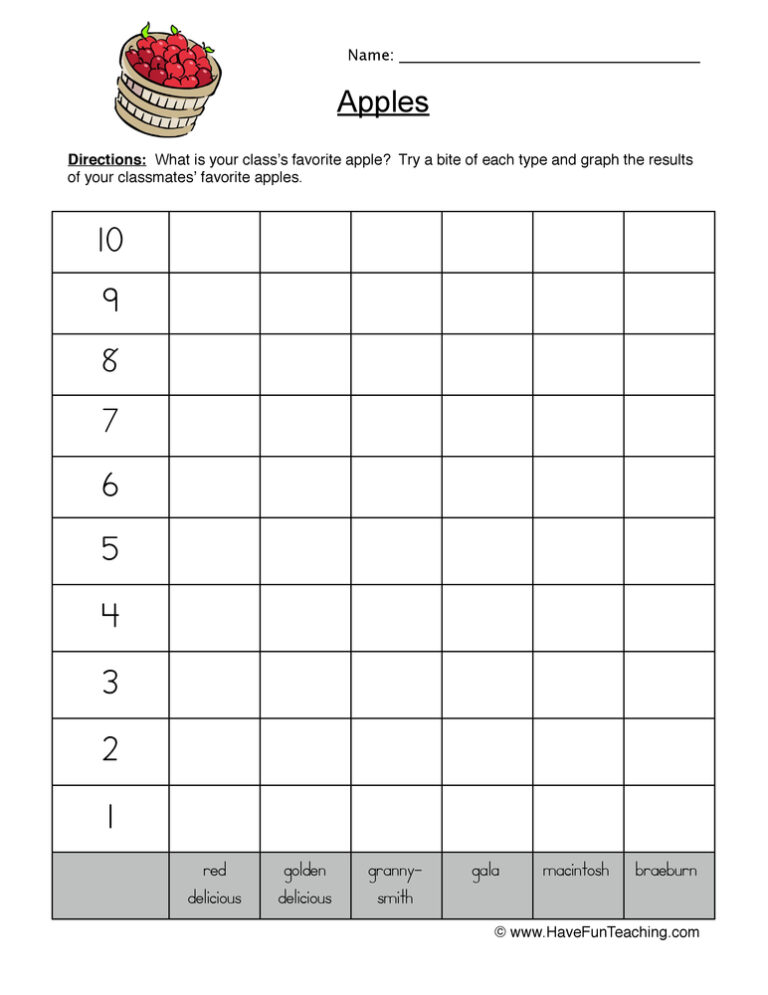
UsingFavorite Apples Worksheet, students survey their classmates to learn about their favorite apples.
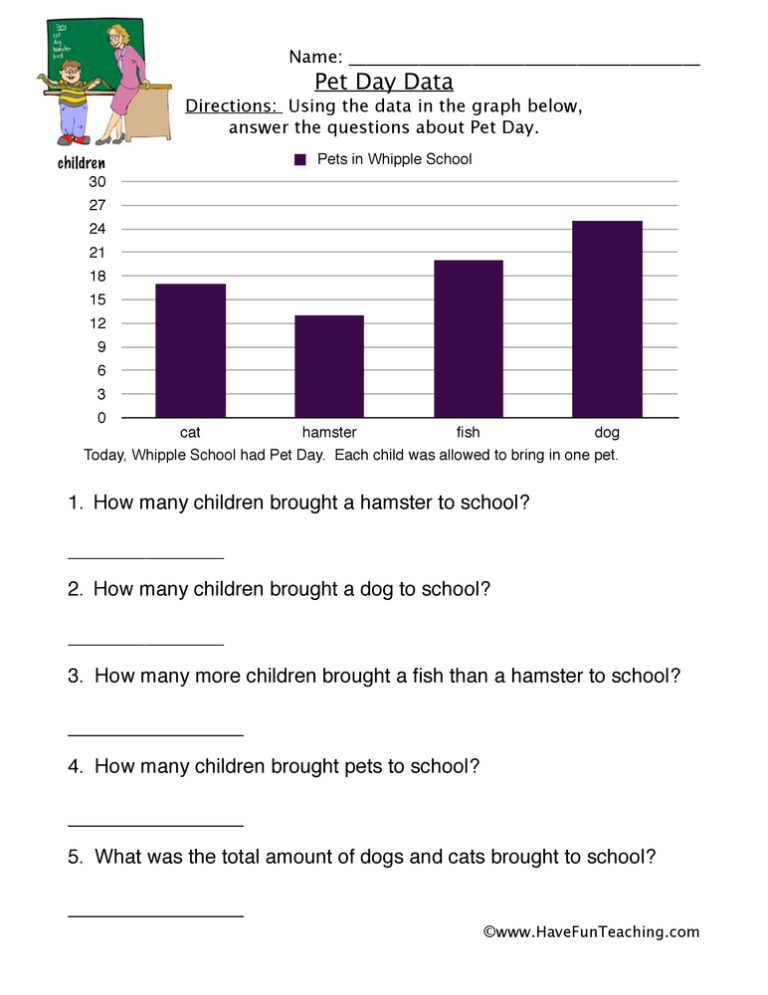
Using this Pet Day Data Worksheet, students analyze the number of pets that came to school on pet day shown on a bar graph.
Using this Let's Get Graphing Activity, students solve one- and two-step “how many more” and “how many less” problems using information presented in scaled bar graphs.
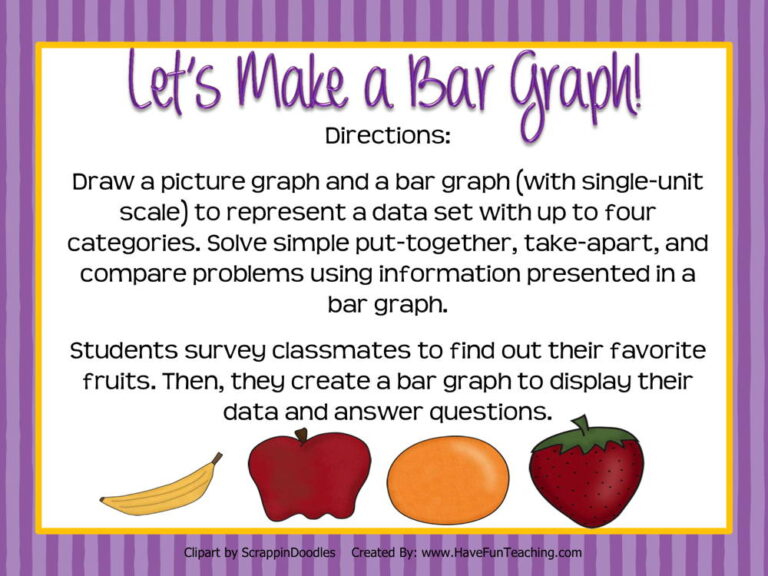
Using this Let's Make a Bar Graph Activity, students draw a picture graph and a bar graph to represent a data set with up to four categories to solve simple put-together, take-apart, and compare problems using information presented in a bar graph.

Using this Counting Graphing Worksheet, students count animal pictures and then record it on a bar graph under the correct animal symbol.



