

Valentine’s Day Candy Heart Graph Worksheet
A Valentine’s Day Candy Heart Graph Worksheet where 2nd graders count tally marks, color a bar graph of four candy colors, and answer four questions about their data. Answer key included for fast, no-prep graphing practice.
$6.97
Or free with a membership — members pay $3.33/mo for all 10,000+ resources. See plans
Want this one free?
Tell us where to send it and it’s yours — no card, no catch.
One free resource per teacher. We’ll also send free teaching ideas each week — unsubscribe anytime.
Teaching is easier with a membership
Unlimited printables, games & videos for PreK–6th — for your classroom or homeschool. Cancel anytime.
Start your 3-day free trial$0 today · cancel anytime · Instant access to 10,000+ resources
About this resource
Description
Graphing is one of the first ways children learn to turn a pile of real objects into information they can read at a glance. When a second grader counts a handful of candy hearts, sorts them by color, and builds a bar graph, they are practicing counting, comparing, and reading data all at once — the exact work of the 2.MD.10 standard. This Valentine’s Day Candy Heart Graph Worksheet gives students a sweet, seasonal set of data to organize, so the skill feels like a treat instead of a drill.
This 2nd grade graphing worksheet arrives ready to teach. Part A gives students a tally chart of four candy heart colors — pink, purple, green, and yellow — and asks them to count the tally marks and color one box in the bar graph for every heart. Part B then turns the finished graph into four questions about the data: which color has the most, which has the fewest, how many hearts there are altogether, and how many more of one color there are than another. Because the data lives on the page, every child works from the same numbers and every answer can be checked against the included key.
What’s Included
- 1 print-ready PDF worksheet
- Answer key
- A 4-color tally chart, a 4-column bar graph to complete, and 4 data questions
Three things make this Valentine’s Day Candy Heart Graph Worksheet stick. First, it moves children through the whole data cycle in one page — count, record, then interpret — so graphing is never just coloring squares. Second, the questions climb in difficulty: naming the tallest bar is easy, finding a total of 21 and a difference of 2 asks for real addition and subtraction. Third, the holiday theme lowers the stakes; a child who freezes at a page of bare numbers will happily count candy hearts.
Teachers and parents can stretch the activity in a few directions. Hand out real conversation hearts, snack-size candies, or paper hearts and let students graph their own sample, then compare graphs across the table and talk about why the bars are different. Turn the graph sideways to introduce horizontal bar graphs, or re-sort the same candy by size or shape to show that the same objects can be graphed more than one way. For a quick warm-up, call out a bar and ask the class to say how many more or fewer it holds than its neighbor.
Related Resources
What teachers say
Reviews
You must be logged in to post a review.
This printable 20 by 20 Blank Graph Paper Worksheet gives 2nd graders a clean 20 by 20 grid for bar graphs, plotting points, and organizing data. A versatile, no-prep template for any math lesson.

Give 2nd Grade graphers an open grid: this 10 by 10 blank graph paper worksheet has 100 equal squares plus lines for the graph title and both labels. Ready for any survey, tally, or weather log.

This making a graph using data worksheet has 3rd graders build a scaled bar graph from an orchard data table, then answer four questions about it. An answer key is included, so graphing practice needs no prep.

An animals bar graph worksheet for 2nd grade: students color one box per animal to build a four-category bar graph, then compare and add using it. Answer key included, so checking data work takes seconds.
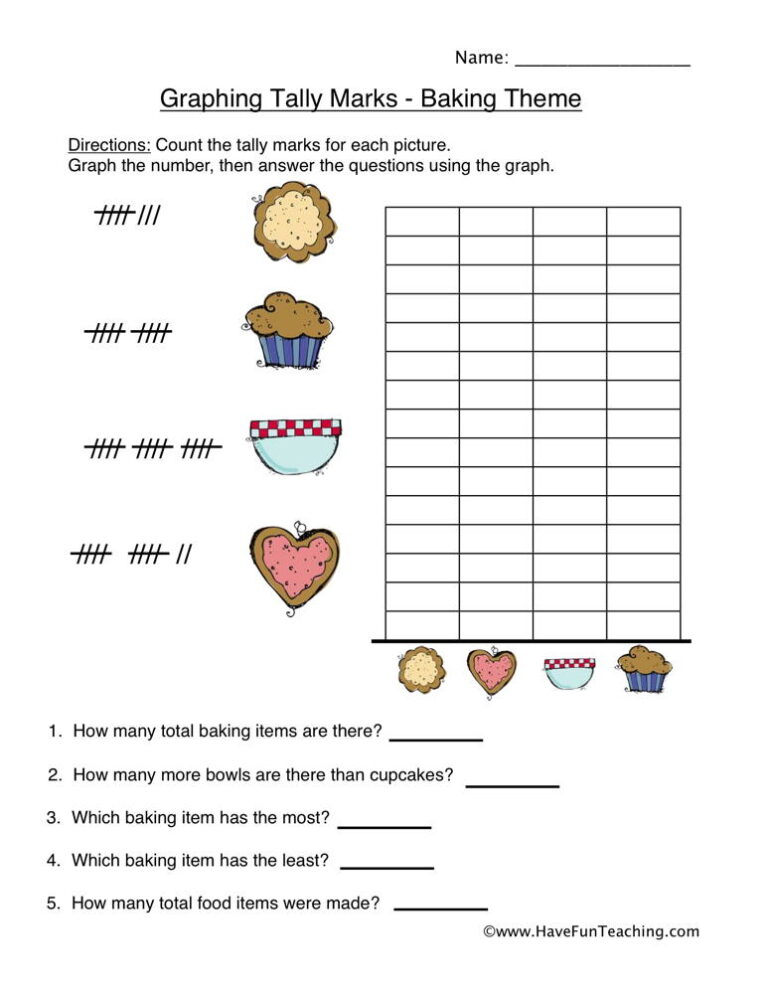
This baking graphing tally marks worksheet has 2nd graders count four sets of tally marks and color a bar graph, then answer four questions. An answer key is included, so checking takes a minute.

This back to school graph worksheet has 2nd graders count a box of school supplies, color a bar graph from their own data, and answer three questions about it. Answer key included for fast, no-prep checking.

This graphing sports worksheet has 2nd Grade students count sports balls, color a bar graph from their own data, and answer three questions about it. An answer key is included.

Using this Graphing Measurements Worksheet, students measure the objects below to create a line graph that shows growth over time.
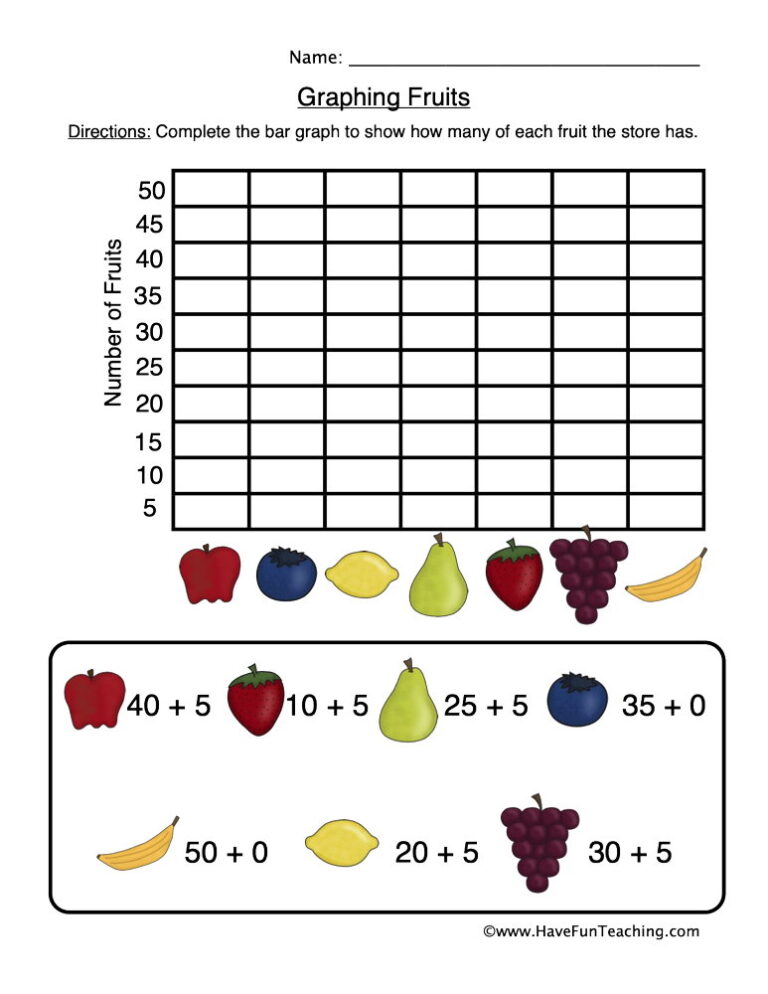
The Graphing Fruits Worksheet has 2nd grade students solve four addition facts, color a bar graph with their answers and read it to answer three questions, with a full answer key.
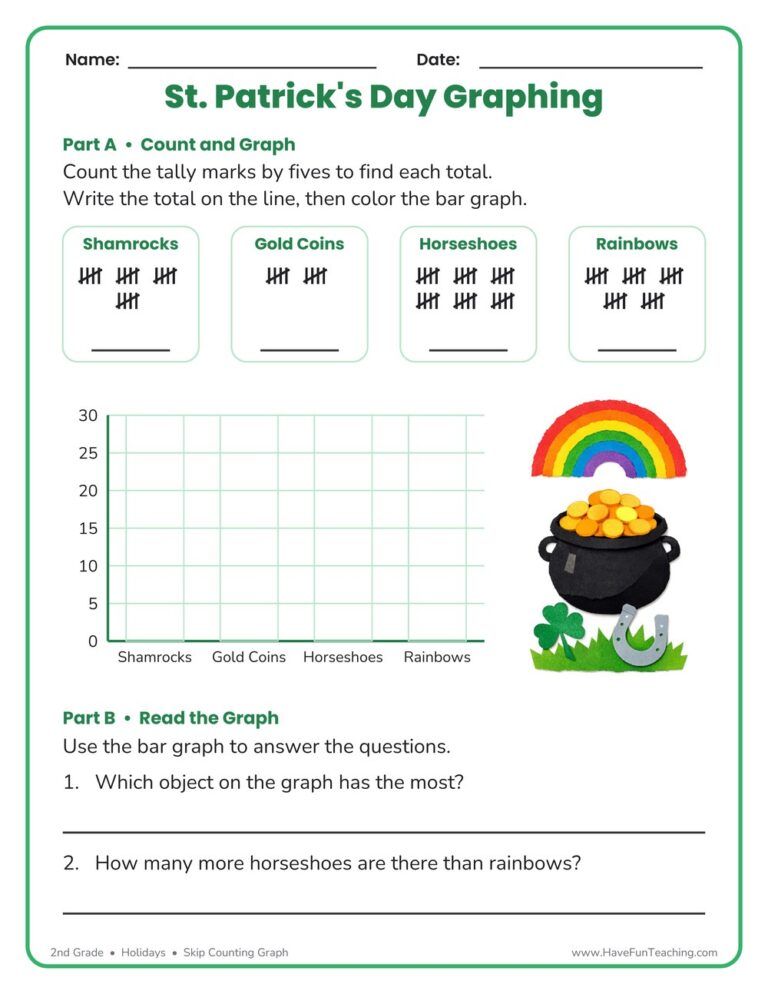
This St. Patrick's Day Skip Counting Graph Worksheet has 2nd Grade students count tally marks by fives, write each total, and color the bar graph. Answer key included, so checking takes seconds.

Using this Summer Graphing Activity, students use the summer spinner to tally what you spin by graphing results.

Using this Sort Count Graph Activity, students count the amount of fruits and vegetables to record them on a graph.




Reviews
There are no reviews yet