

Favorite Vegetables Worksheet
This favorite vegetables worksheet has 1st graders count tally marks from a class vote, color a bar graph, and answer questions. An answer key is included for quick, easy checking.
$6.97
Or free with a membership — members pay $3.33/mo for all 10,000+ resources. See plans
Want this one free?
Tell us where to send it and it’s yours — no card, no catch.
One free resource per teacher. We’ll also send free teaching ideas each week — unsubscribe anytime.
Teaching is easier with a membership
Unlimited printables, games & videos for PreK–6th — for your classroom or homeschool. Cancel anytime.
Start your 3-day free trial$0 today · cancel anytime · Instant access to 10,000+ resources
About this resource
Description
Every class has an opinion about vegetables, and this favorite vegetables worksheet turns those opinions into real data work for first graders. A class has voted for its favorite vegetable, and the votes are recorded as tally marks beside a carrot, an ear of corn and a pod of peas. Children count the tally marks in each row, remembering that a bundle of four marks with a line across it stands for five. Then they turn those three totals into a bar graph and use the graph to answer questions. It is a complete, friendly lap through organizing, showing and reading data with three categories.
The sheet is set up in three numbered steps so young learners always know what comes next. First they read the tally chart. Next they color one square on the graph for each vote, building a bar for every vegetable on a scale from 1 to 8. Last, they answer three short questions: how many votes one vegetable got, which vegetable got the most votes, and how many more votes one got than another. Simply print it, hand it out, and let children work at their own pace.
What’s Included
- A tally chart of class votes for three favorite vegetables
- A blank bar graph to color, one square for each vote
- Three read-the-graph questions, including a how-many-more question
- A complete answer key on page 2
Why This Worksheet Helps Kids
First, reading tally marks in groups of five builds counting fluency and prepares children for skip counting. Second, coloring the graph from the tally chart shows kids that the same information can be shown in more than one way. Third, the comparison question asks children to find a difference, which connects graphing to subtraction and gets them thinking about what the data means.
Ideas for Teachers and Parents
This 1st grade graphing worksheet makes a great follow-up to a real class vote. Take your own vegetable survey with tally marks on the board, then let children compare your class results with the ones on the sheet. At home, parents can have kids tally the vegetables served at dinner for a week. Use the favorite vegetables worksheet as a math center, homework, or a quick check of 1st grade data skills.
Related Resources
What teachers say
Reviews
You must be logged in to post a review.

This making a graph using data worksheet has 3rd graders build a scaled bar graph from an orchard data table, then answer four questions about it. An answer key is included, so graphing practice needs no prep.
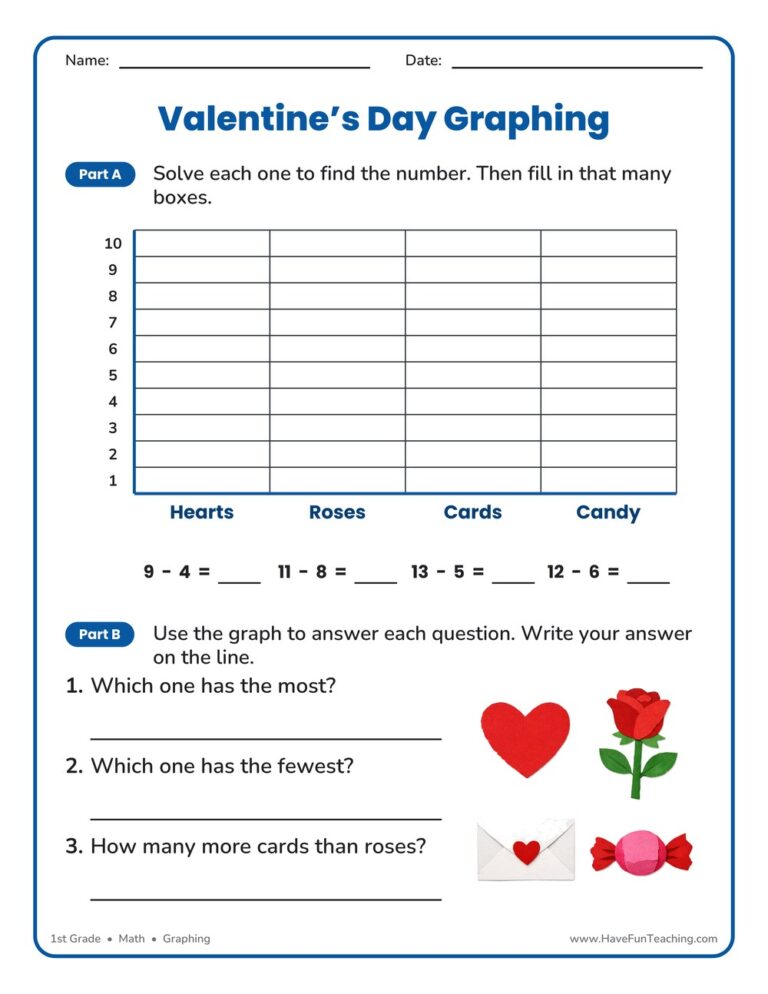
This Valentine's Day Graphing Worksheet has 1st Grade students solve four subtraction facts, fill in a bar for each answer, and read the graph they built. Answer key included, so checking takes seconds.
Using this Bar Graph Activity, students practice using data to create and analyze a bar graph.
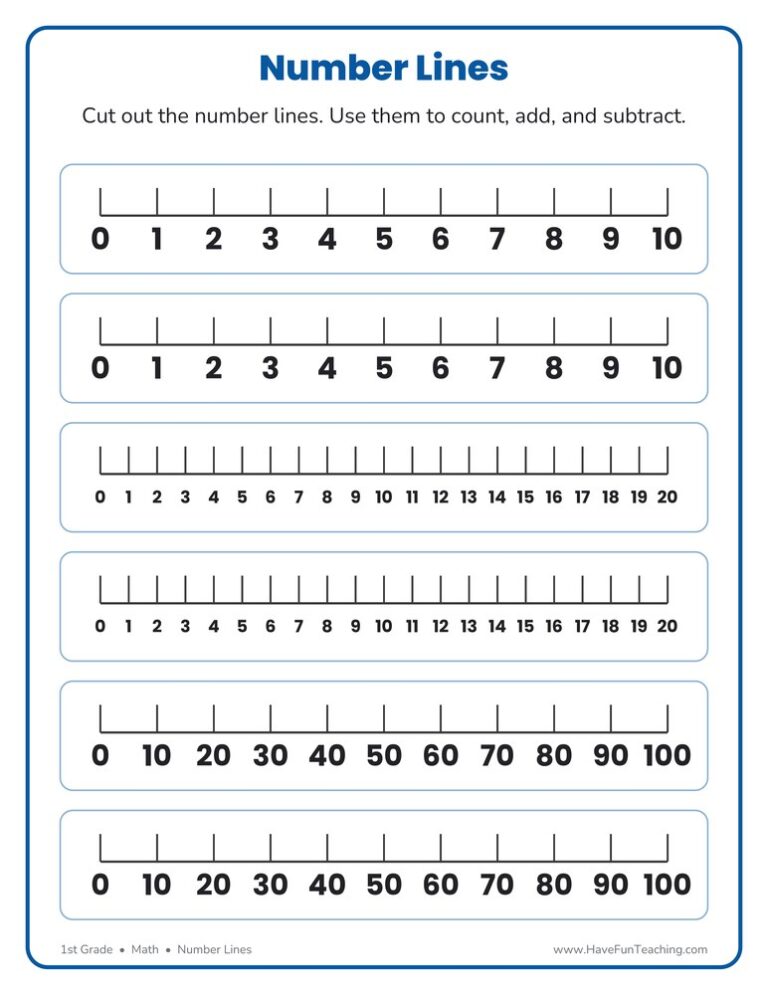
This number lines template worksheet prints six cut-out number lines for 1st grade: two to 10, two to 20, and two counting by tens to 100. Hand one to every student for counting, adding, and subtracting.

Using this Summer Graphing Activity, students use the summer spinner to tally what you spin by graphing results.
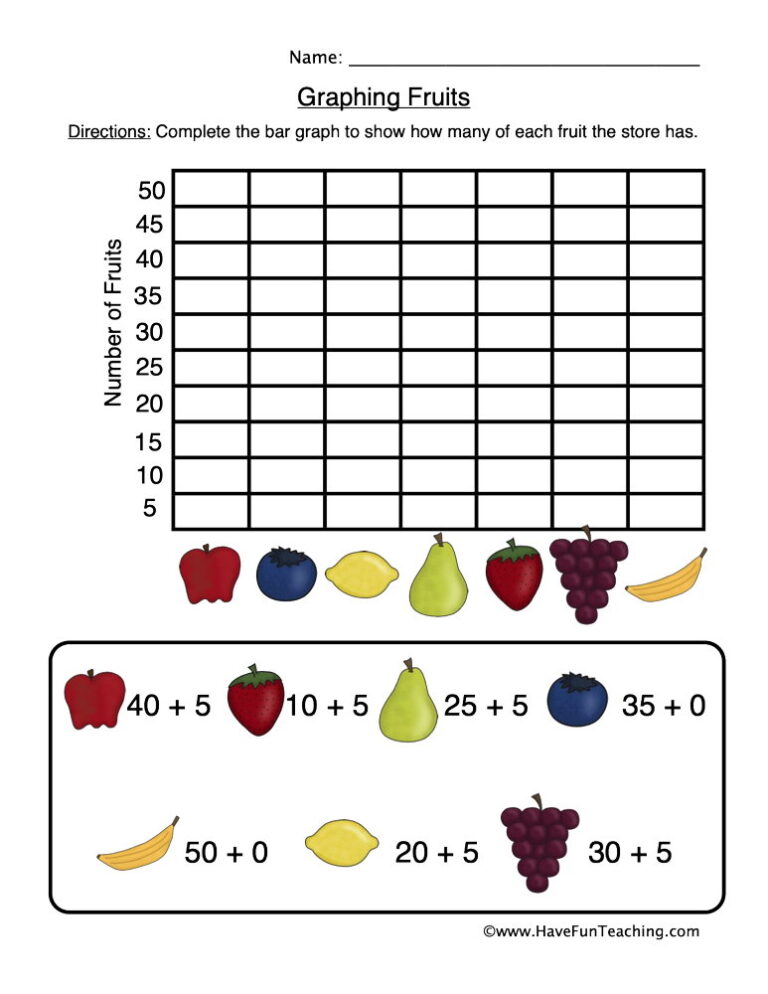
The Graphing Fruits Worksheet has 2nd grade students solve four addition facts, color a bar graph with their answers and read it to answer three questions, with a full answer key.

This Christmas cookies counting tally marks worksheet helps 1st grade students count holiday cookies, draw tally marks and read tally groups by fives. An answer key is included for quick, confident checking.

Using this Sort Count Graph Activity, students count the amount of fruits and vegetables to record them on a graph.

This graphing school tools worksheet has 1st graders count 18 backpacks, markers and rulers, color a bar graph from their own count, and answer three questions about it. Answer key included for fast, no-prep data practice.
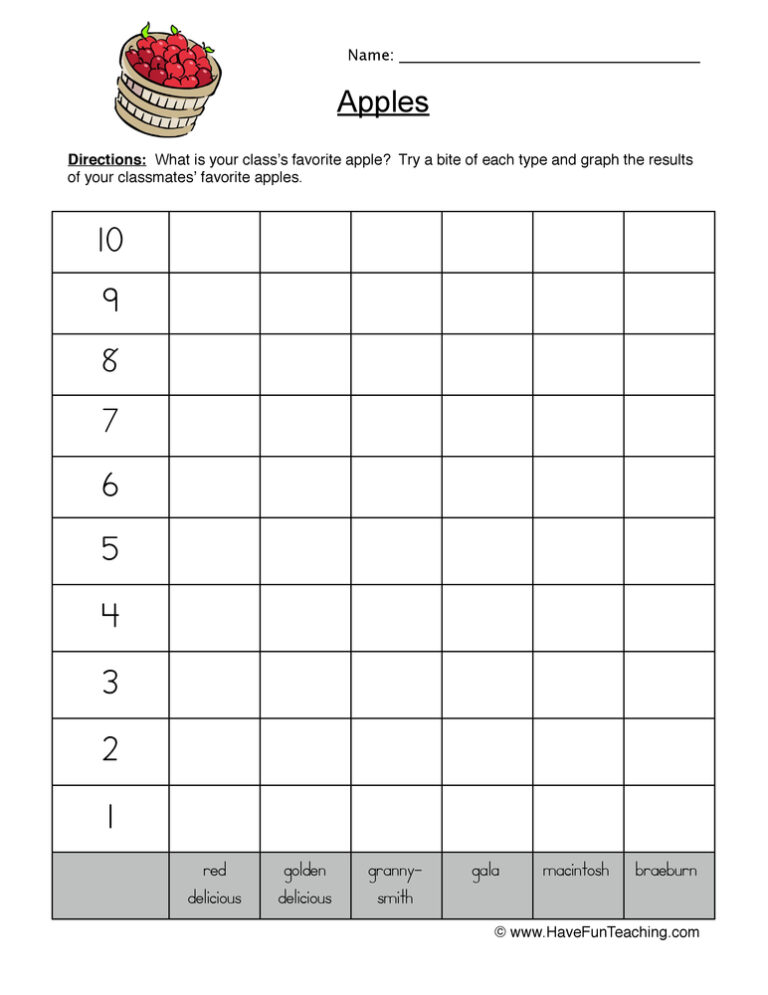
UsingFavorite Apples Worksheet, students survey their classmates to learn about their favorite apples.

Using this Gathering Information from a Graph Worksheet, students answer questions about balloons for a party using the data from the graph.

Using this Graphing Worksheet - Animals, students analyze a pie chart about animals.




Reviews
There are no reviews yet