
Matching Pie Graphs Worksheet
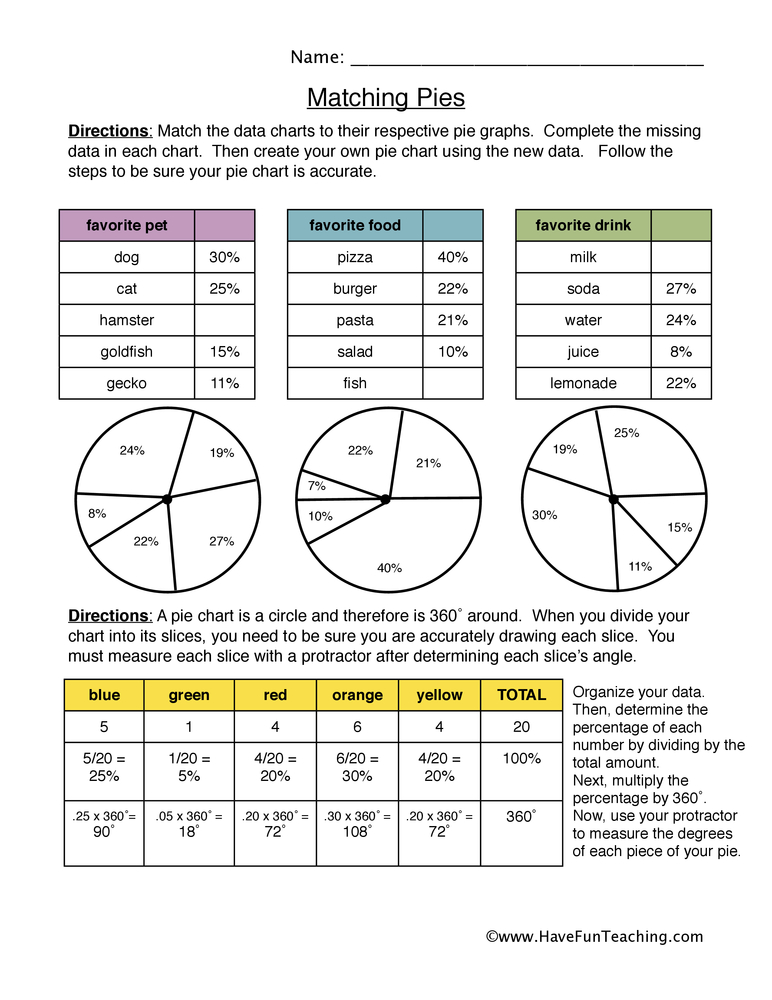
This Matching Pie Graphs Worksheet has 5th Grade students complete three data tables, match each table to its pie graph, and answer three questions. An answer key is included, so practice with circle graphs is easy to check.
$6.97
Or free with a membership — members pay $3.33/mo for all 10,000+ resources. See plans
Want this one free?
Tell us where to send it and it’s yours — no card, no catch.
One free resource per teacher. We’ll also send free teaching ideas each week — unsubscribe anytime.
Teaching is easier with a membership
Unlimited printables, games & videos for PreK–6th — for your classroom or homeschool. Cancel anytime.
Start your 3-day free trial$0 today · cancel anytime · Instant access to 10,000+ resources
About this resource
Description
A pie graph turns a whole set of data into one circle, so students can compare parts at a single glance. This matching pie graphs worksheet gives fifth graders focused practice with circle graphs and percents. Students complete three survey data tables so that the percents in each one total 100, then study three finished pie graphs and decide which graph goes with which table. Every graph is built from a different set of percents, so students have to read the data carefully instead of guessing.
The worksheet fits a data and graphing unit, a percent review, or independent morning work. In Part A, students find the one missing percent in each table. In Part B, they compare the labeled slices on each pie graph to the numbers in the tables and write the matching letter. Part C closes with three questions that ask them to compare two categories, connect one fourth to 25 percent, and explain in writing why a data table always totals 100 percent. A complete answer key is the last page of this 5th grade graphing worksheet, so it is quick to grade or hand out for self-checking.
What Is Included
- One printable worksheet page plus a full answer key page
- Three survey data tables, each missing one percent to solve
- Three labeled pie graphs to match to the correct data table
- Three follow-up questions, including a written explanation
- Name and date line at the top for easy classroom use
Three Reasons This Helps Students
First, it builds part-to-whole thinking. Filling a missing percent so the table reaches 100 shows students that the slices of a circle graph always account for every response. Second, it strengthens data reading. Matching a graph to a table means checking several values in a row, which is exactly the skill state tests ask for when students interpret a chart. Third, it connects fractions and percents. Recognizing that one fourth of the students is the same as 25 percent moves students toward the flexible number sense they need in middle school.
Teacher and Parent Ideas
Run a quick class survey before handing out the page, then have students build their own data table and circle graph from the results. Pair students and ask each partner to explain out loud how they knew a graph matched a table. This matching pie graphs worksheet also works well as a math station. For an extension, have students turn one of the tables into a bar graph and talk about which display is easier to read. At home, use a favorite snack or favorite pet survey with family members to make the numbers personal.
Related Resources
What teachers say
Reviews
You must be logged in to post a review.
This 50 by 50 blank graph paper gives 5th grade math students a clean, pre-numbered coordinate grid (0 to 50 by fives) for plotting points and graphing data. Two ready-to-print grid pages make neat, accurate graphs simple at home or school.
This 30 by 30 blank graph paper gives 5th graders a large, reusable grid for graphing and plotting points. Print it for coordinate plotting, bar graphs, geometry, and everyday math practice.
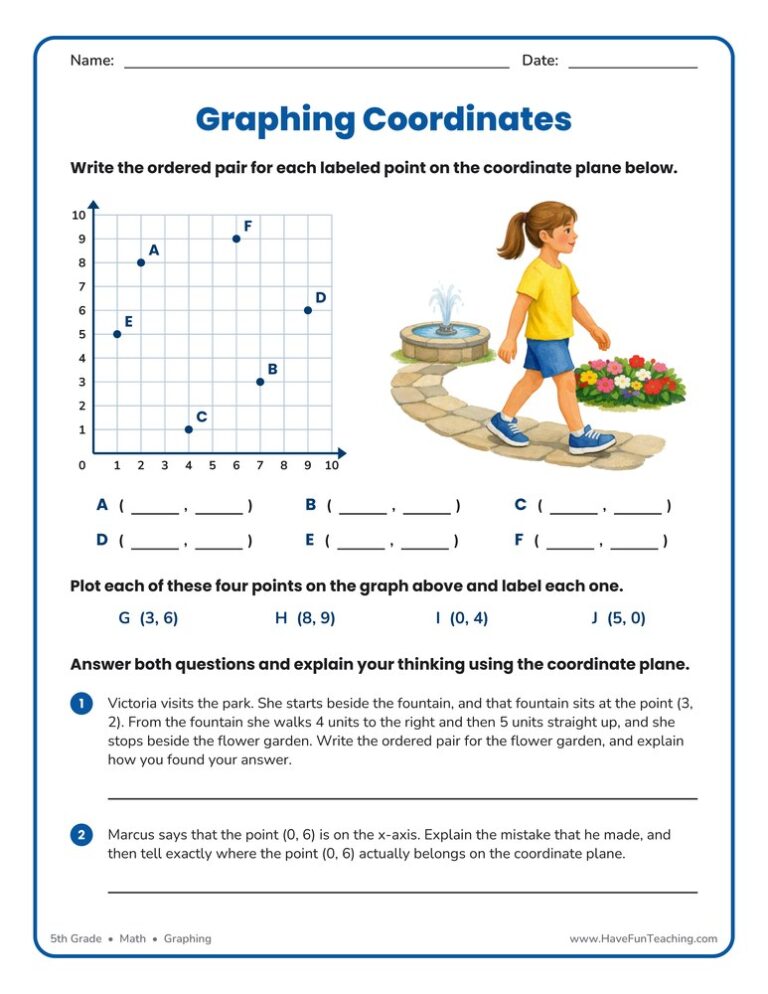
This Plotting Graphing Coordinates Worksheet gives 5th Grade students practice naming and plotting points on a coordinate plane. An answer key is included, so children can check their own work and build confidence fast.
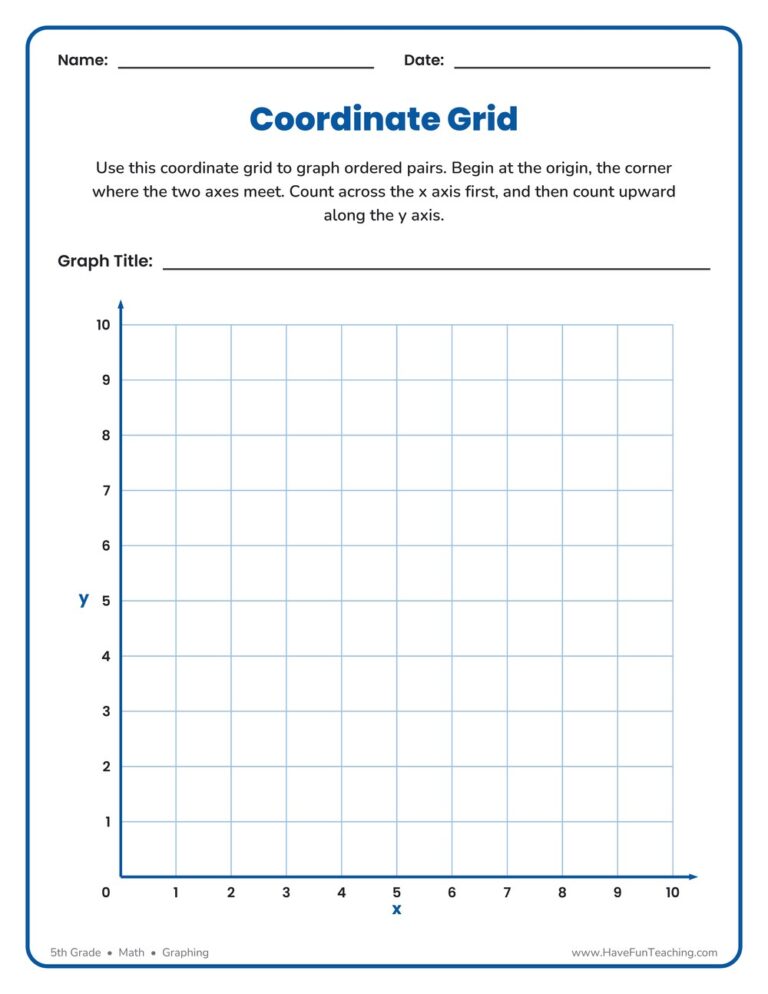
Use this blank coordinate grid to help 5th Grade students plot ordered pairs on a first-quadrant coordinate plane. A reusable graphing template for lessons, warm-ups, and math centers.

A garden-themed Find Coordinate Pairs Worksheet where 5th graders write ordered pairs for plotted points, then plot and connect four corners to find a perimeter. Answer key included for fast, no-prep graphing practice.
This 1000 by 1000 blank graph paper gives 5th grade students a first-quadrant grid with both axes numbered to 1000, plus title and label lines, so any data set is easy to plot.
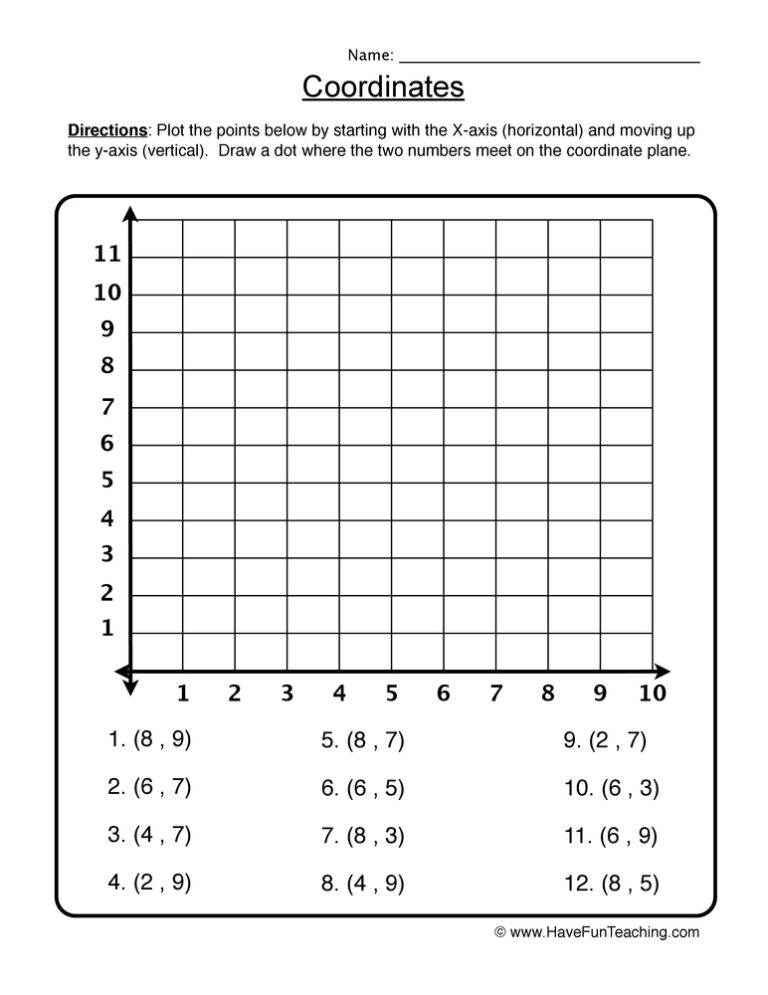
This Use Coordinate Pairs Worksheet asks 5th graders to name four plotted points, plot four more ordered pairs on the same grid, and explain their thinking. An answer key is included for fast, no-prep graphing practice.

This 500 by 500 blank graph paper worksheet gives 5th grade students a first quadrant grid numbered by fifties, with title and axis label rules, so they can plot and graph their own data with confidence.
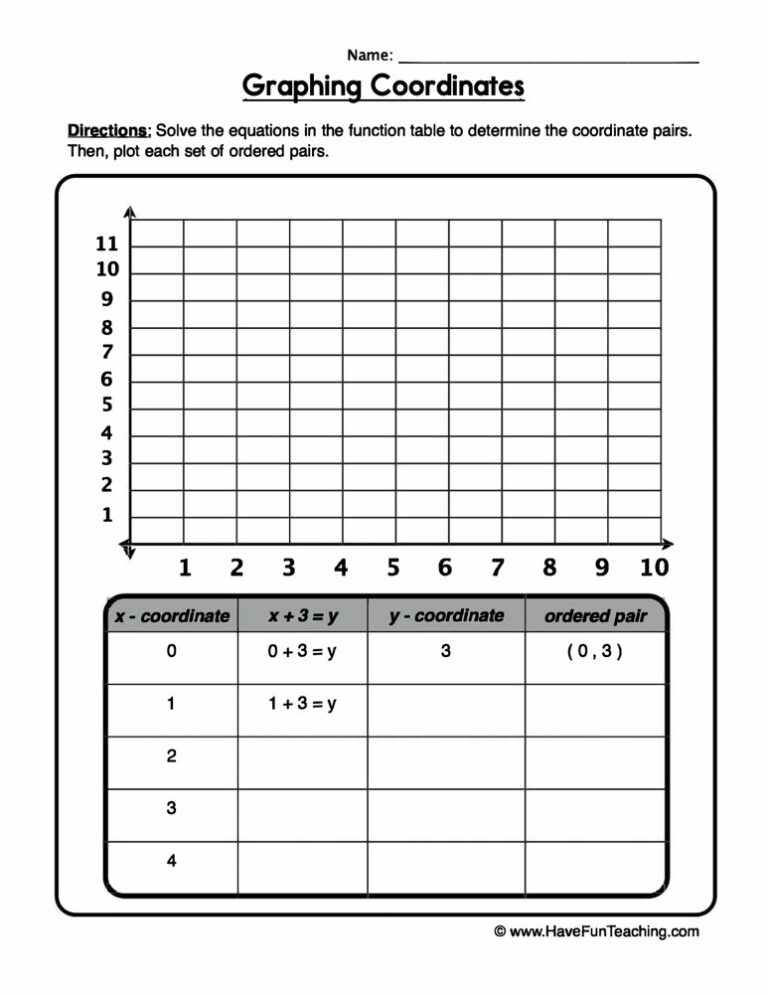
This Graphing Coordinates Equations Worksheet has 5th graders solve a function table, plot the ordered pairs on a grid, and explain the pattern. Answer key included for fast, no-prep coordinate practice.

Using this Graphing Measurements Worksheet, students measure the objects below to create a line graph that shows growth over time.
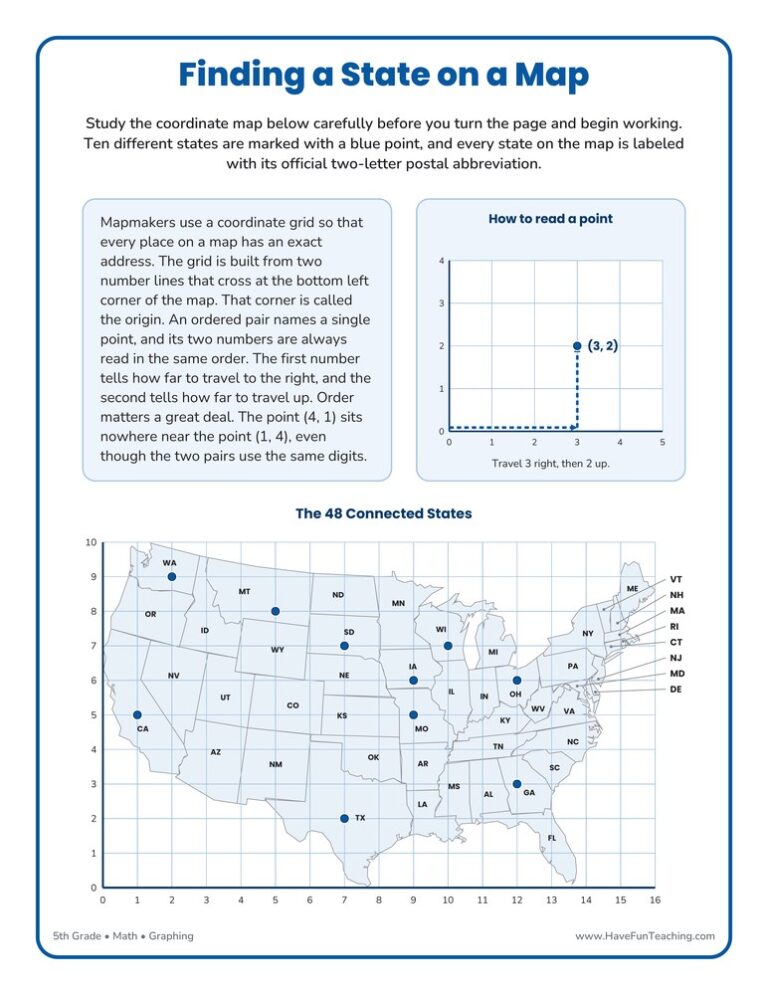
This Finding a State on a Map Worksheet gives 5th grade students a coordinate grid drawn over a United States map, plus a full answer key, so ordered pairs finally point at real places.

This Decimals Bar Graphs Worksheet asks 5th Grade students to add and subtract decimals to hundredths, then shade a bar to each answer on a 0.00 to 1.00 scale. An answer key is included.




Reviews
There are no reviews yet