

Timeline Graphic Organizer Worksheet
This timeline graphic organizer worksheet has 3rd grade students place four dated events on a decade time line, then subtract dates to find elapsed years. An answer key is included.
$6.97
Or free with a membership — members pay $3.33/mo for all 10,000+ resources. See plans
Want this one free?
Tell us where to send it and it’s yours — no card, no catch.
One free resource per teacher. We’ll also send free teaching ideas each week — unsubscribe anytime.
Teaching is easier with a membership
Unlimited printables, games & videos for PreK–6th — for your classroom or homeschool. Cancel anytime.
Start your 3-day free trial$0 today · cancel anytime · Instant access to 10,000+ resources
About this resource
Description
This timeline graphic organizer worksheet gives third graders a real timeline to read instead of an empty arrow to fill in. Four events from the history of the bicycle are printed in a box with their years, and a decade-by-decade time line runs across the page from 1810 to 1910. Students have to find where each year lands on the scale, which is the part of timeline work that a blank organizer never actually teaches.
Part A is the placing. Each event carries a letter, and students write that letter in the circle above the year it belongs to. The events are not listed in the order they happened, so the letters do not simply run left to right and students have to read the years. Part B is the reading. Four questions ask how many years passed between two events, so students subtract dates and see that the distance on the page stands for real time. A full answer key on page two shows every letter in place and every elapsed-year answer.
What’s Included
- One printable worksheet page and one answer key page
- A box of four dated events from the history of the bicycle
- A horizontal time line marked and labeled every ten years from 1810 to 1910
- Four elapsed-year questions with answer lines
- A ready-to-print PDF sized for standard letter paper
Three Reasons This Helps Kids
- Placing a year on a marked scale turns a timeline into something a student reads, not just a shape they copy.
- Subtracting two dates connects social studies to the subtraction students are already practicing in math.
- Seeing that fifty years is a long stretch of the page builds the sense of scale that later history lessons depend on.
Teacher and Parent Ideas
Run this 3rd grade timeline activity at the start of a history unit so students meet the tool before they meet the content. Ask which gap on the page is the longest and why that might be, then talk about what else was changing in those years. Early finishers can add one more event to the time line and write a question about it for a partner. At home, families can build the same kind of line for a child’s own life, marking the year they were born, started school, and learned to ride a bike. Because this timeline graphic organizer worksheet includes an answer key, it also works well for independent practice, substitute plans, early finisher folders, and homeschool social studies.
Related Resources
What teachers say
Reviews
You must be logged in to post a review.
These Arrow Cut Outs will quickly give you templates for classroom decoration or student activities.

Using RI.3.8 Third Grade Common Core Lesson, students describe the connection between a series of historical events, scientific ideas or concepts, or steps in technical procedures in a text.
Using this Sequence of Events Cycle Graphic Organizer, students describe the major events that occur in the beginning, middle, and end while reading.
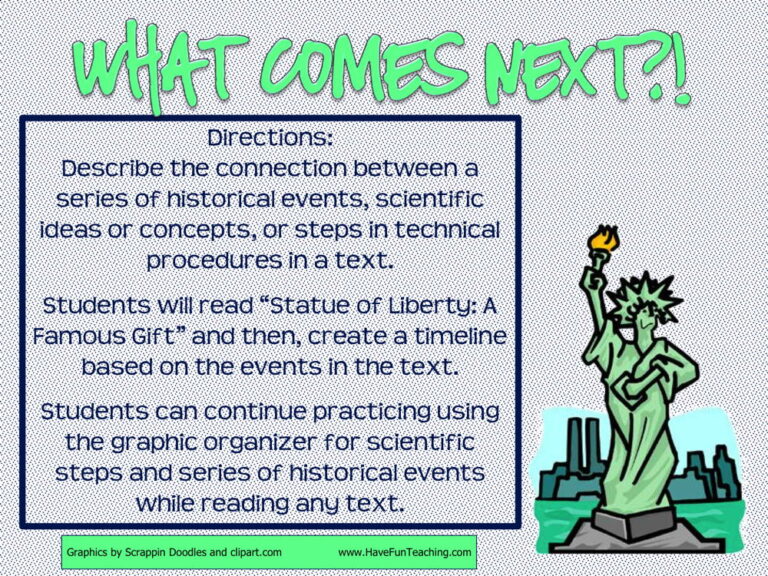
In order to use this What Comes Next? Timeline Activity, your students will describe the connection between a series of historical events, scientific ideas or concepts, or steps in technical procedures in a text.
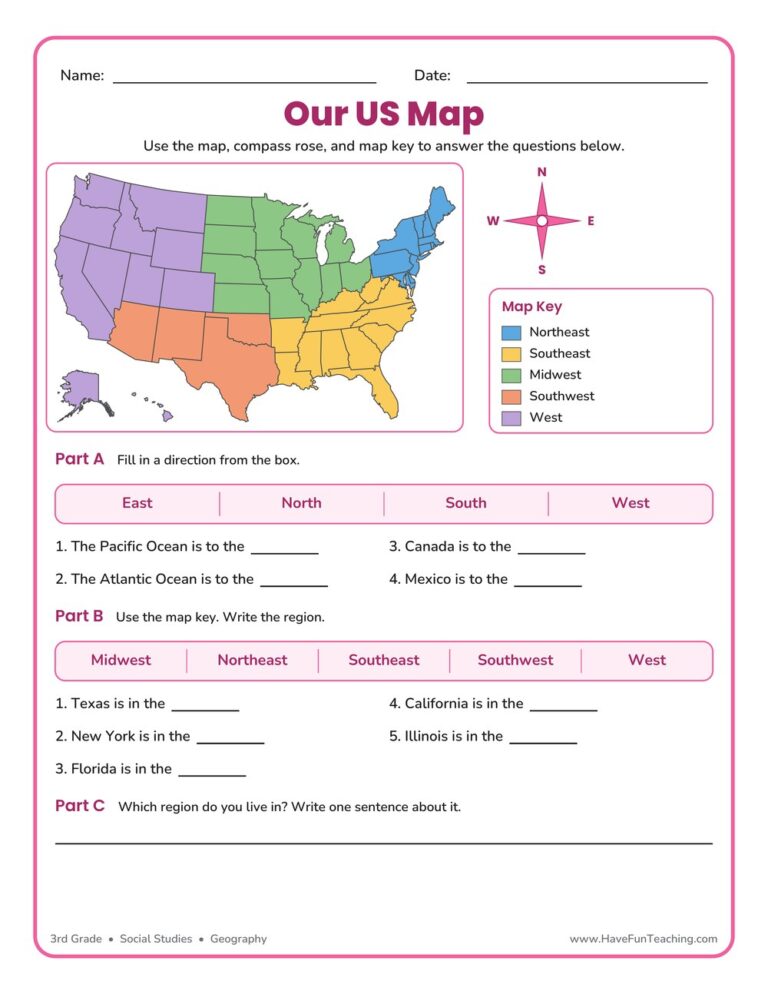
This US Map Worksheet helps 3rd grade students name the five regions of the United States, use a compass rose, and read a map key. An answer key is included, making map skills easy and fun to practice.
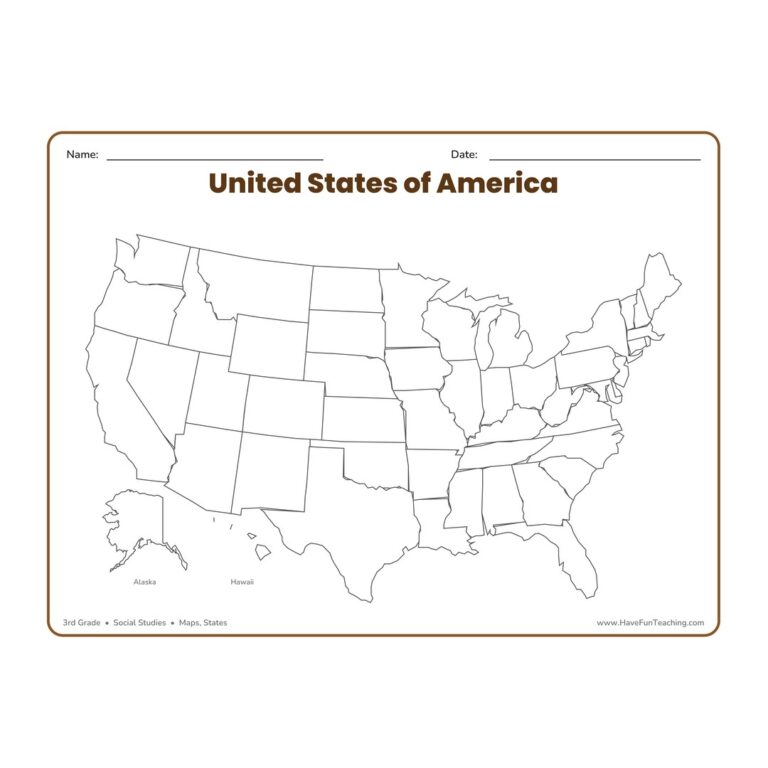
The United States Blank Map Worksheet gives 3rd graders a full, landscape outline map of the USA with all fifty states left blank and ready to label, color, or study for hands-on geography and map-skills practice.

This who what when where why graphic organizer worksheet helps 3rd graders record the five key details — who, what, when, where, and why — from any story or article. A clear, reusable note-taking template.
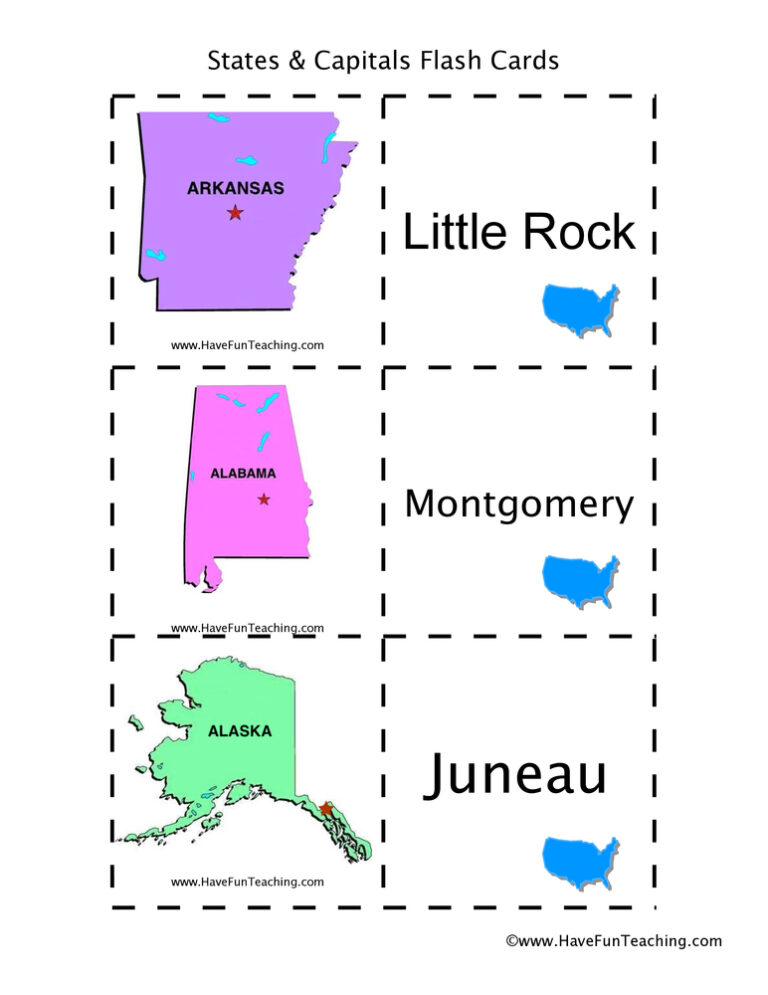
Using US States and Capitals Flash Cards, students memorize US State capitals by looking at a picture of the state.
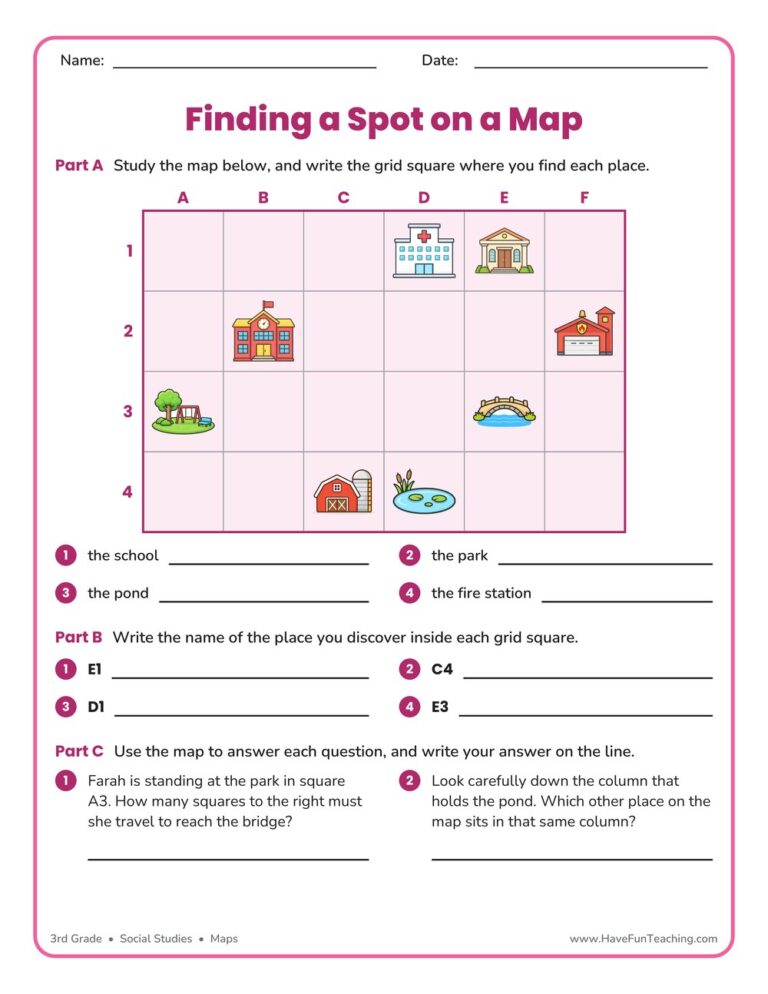
A finding a spot on a map worksheet for 3rd grade, built on one labeled town grid with place-to-square, square-to-place, and reasoning questions. Answer key included for quick no-prep map skills practice.
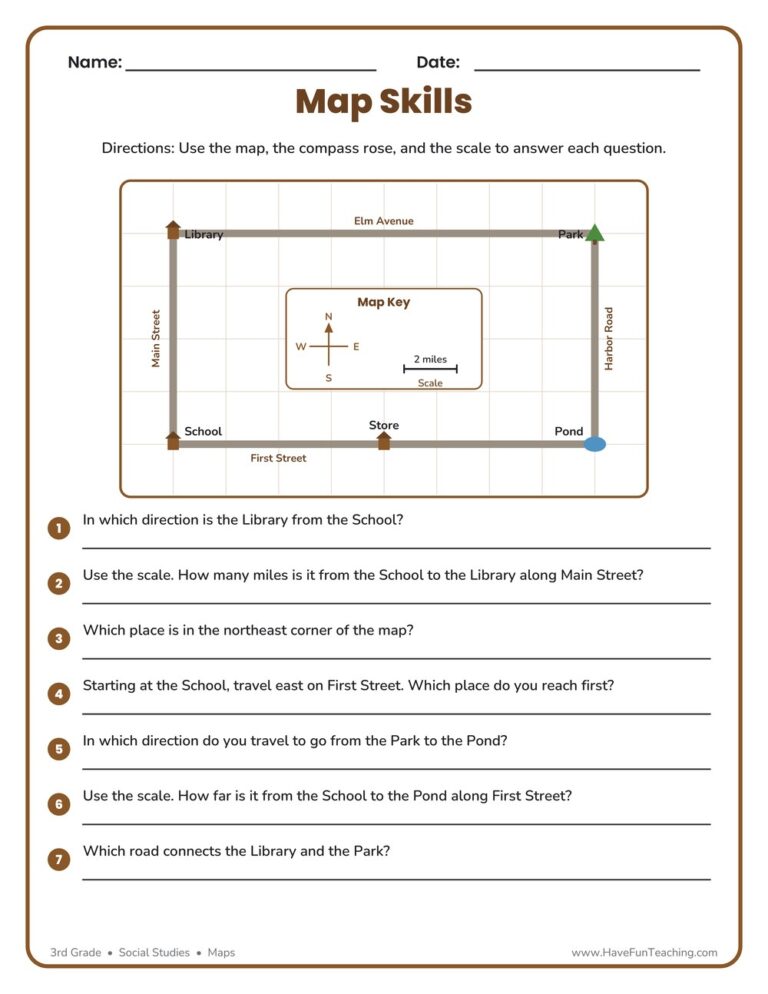
This Map Skills Worksheet gives 3rd graders a friendly town map for practicing the compass rose, legend, and scale to find places and measure distances. Includes a complete answer key for quick, no-prep social studies practice.
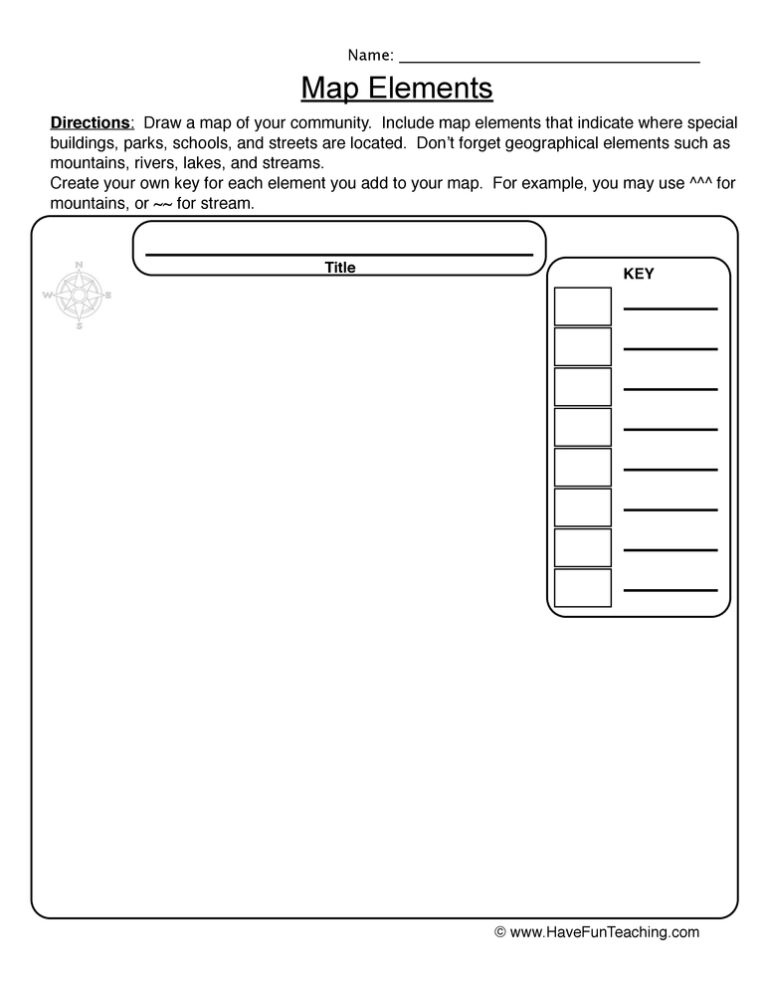
This Make a Map Worksheet gives 3rd graders a real town map to label and read, covering the title, map key, compass rose, and scale bar. Answer key included for fast, no-prep geography practice.





Reviews
There are no reviews yet