
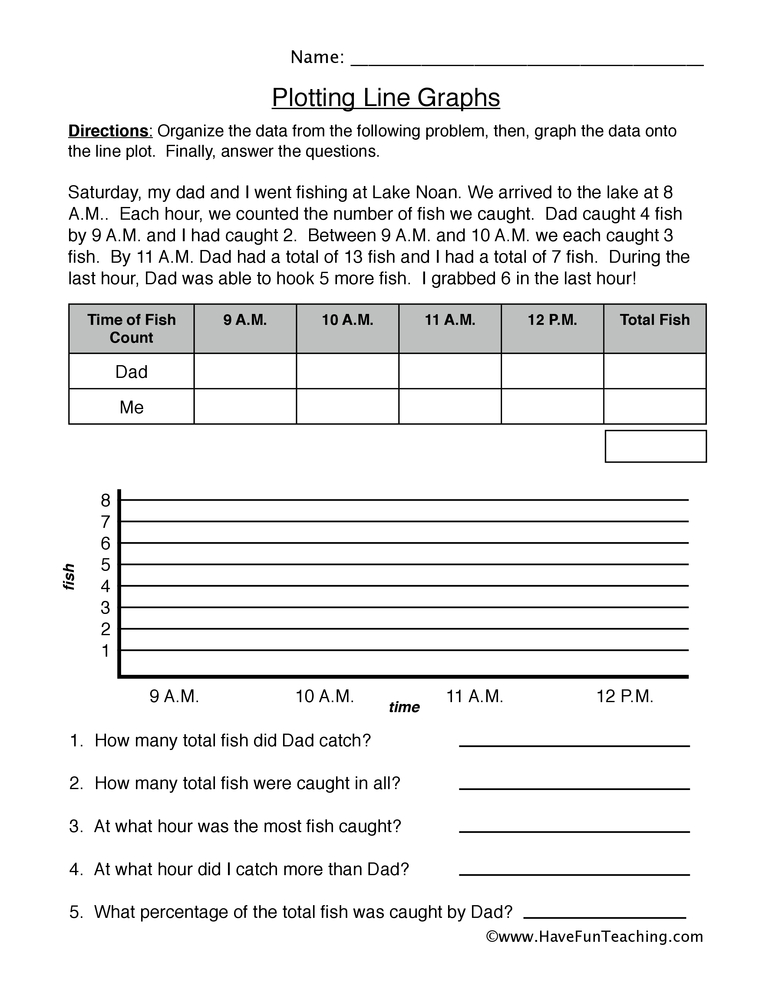
Plotting Line Graphs Worksheet
This plotting line graphs worksheet has 4th grade students turn a lemonade stand story into a data table and a line graph, with an answer key, building strong data skills.
$6.97
Want this one free?
Tell us where to send it and it’s yours — no card, no catch.
One free resource per teacher. We’ll also send free teaching ideas each week — unsubscribe anytime.
Free teacher account · no credit card
Membership
Get every game, song, & printable
- Every game, on any device
- 6,500+ resources
- Assign online with HFT Classroom
Then $39.97/year · cancel anytime · See plans
- Instant digital download
- Printable PDF + answer key
- Made by real teachers
Teacher / Family membership
Teaching is easier with every resource
One membership for your whole year: 6,500+ worksheets, games, songs and videos for Preschool–6th, for your classroom or homeschool.
- Unlimited printables & downloads
- Every game, on any device
- Assign online with HFT Classroom
- Cancel anytime
Teacher / Family membership · 3 days free
Yearly
Monthly would be $119.64 a year
$3.33/month
Billed $39.97 once a year
You save $79.67 every year
Start My 3 Free Days$0 today · cancel anytime
Monthly
$9.97/month
Flexible, month to month
Yearly is just $3.33/mo. Switch and save $79.67
Start My 3 Free Days$0 today · cancel anytime
About this resource
Description
Line graphs show how data changes over time, and this plotting line graphs worksheet gives 4th grade students real practice turning a word problem into a graph. Students read a short story, pull the numbers out of it, and organize them before they ever draw a point.
About This Worksheet
In this plotting line graphs worksheet, students read about Piper’s lemonade stand and the number of cups she sold each hour. First they complete a data table, including one value they must figure out from a clue in the story. Next they plot each hour’s sales on a line graph with a scale that counts by fours and connect the points in order. Finally, they answer questions that ask them to find a total, compare the busiest and slowest hours, and explain a trend in the data.
What’s Included
- One printable line graph worksheet with a data story, a table, a graph grid, and three questions
- A complete answer key with the finished table, the plotted line graph, and sample answers
Why This Worksheet Helps Kids
Students learn to organize information from text into a table, which is a key step in solving multi-step word problems. Plotting points on a scaled axis builds number sense and careful reading of intervals. Reading the finished graph to find totals, differences, and trends helps students see that a 4th grade line graph worksheet is really about telling the story behind the numbers.
Ideas for Teachers and Parents
Use this worksheet as a math center, a homework page, or a quick assessment after a lesson on graphing. Invite students to collect their own data, such as the temperature each hour or the number of pages they read each day, and make a new line graph. Ask partners to write one more question about Piper’s graph and trade with a classmate.
Related Resources
What teachers say
Reviews
Write a review, earn store credit
Get 25¢ in credit for every approved review of a resource you’ve downloaded, played or purchased — up to 15 a month. Credit applies automatically to your membership payments, so your reviews can help pay for your membership.
Honest reviews only — any star rating earns the same. Program rules
Log in to write a review and earn store credit.
A Florida FAST 4th grade math practice test workbook for teachers, with a pretest, skill practice for all 39 benchmarks, mixed review and 2 full-length practice tests. Answer key included, so test prep is ready to go.

This making a graph using data worksheet has 3rd graders build a scaled bar graph from an orchard data table, then answer four questions about it. An answer key is included, so graphing practice needs no prep.

This Money Graphing Worksheet asks 4th graders to add dollars and cents, total each student's fundraising, and graph the results on a scaled bar graph. An answer key is included, so checking accurate work takes seconds.

This average state temperatures graphing worksheet has 4th graders read a scaled bar graph of monthly temperatures, then find the average of four of them. Answer key included, so data practice takes no prep.
A Smarter Balanced (CAASPP / SBAC) 4th grade math practice test workbook for teachers, with a pretest, skill practice for all 38 standards, mixed review and 2 full-length practice tests. Answer key included, so test prep is ready to go.

This rocks and minerals graphing worksheet has 4th grade students total rock samples, draw a scaled bar graph, and solve word problems. An answer key is included for quick, easy checking.
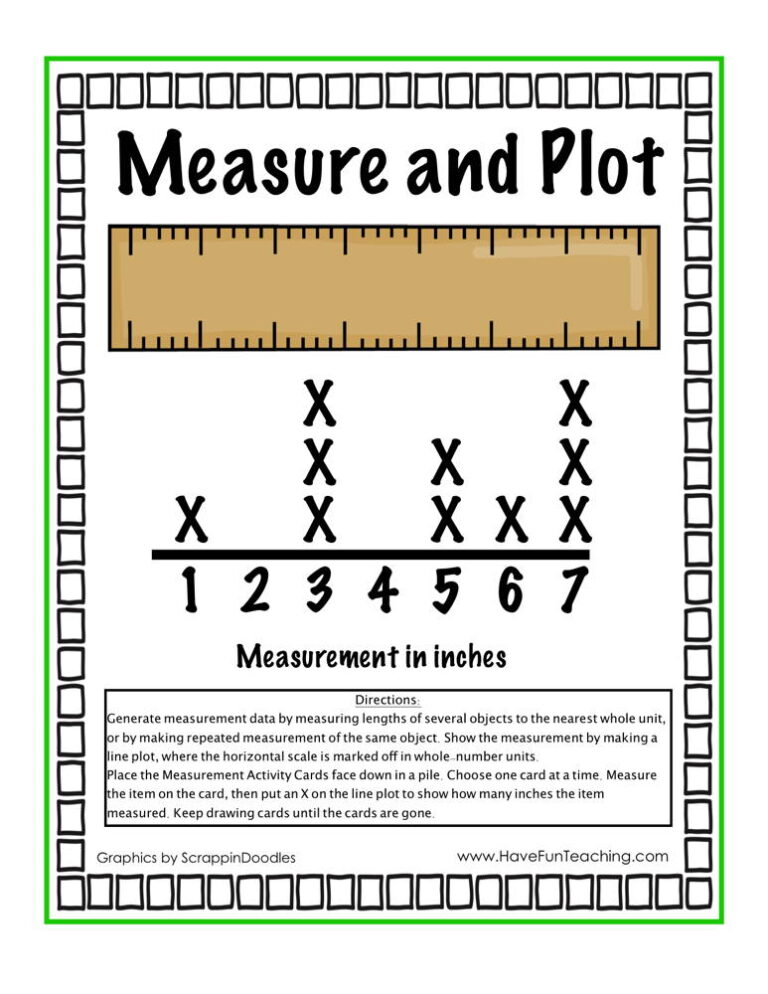
In this measure and plot data activity, 3rd to 5th grade students measure true-size objects to the nearest quarter inch and build a line plot. Answer key included.
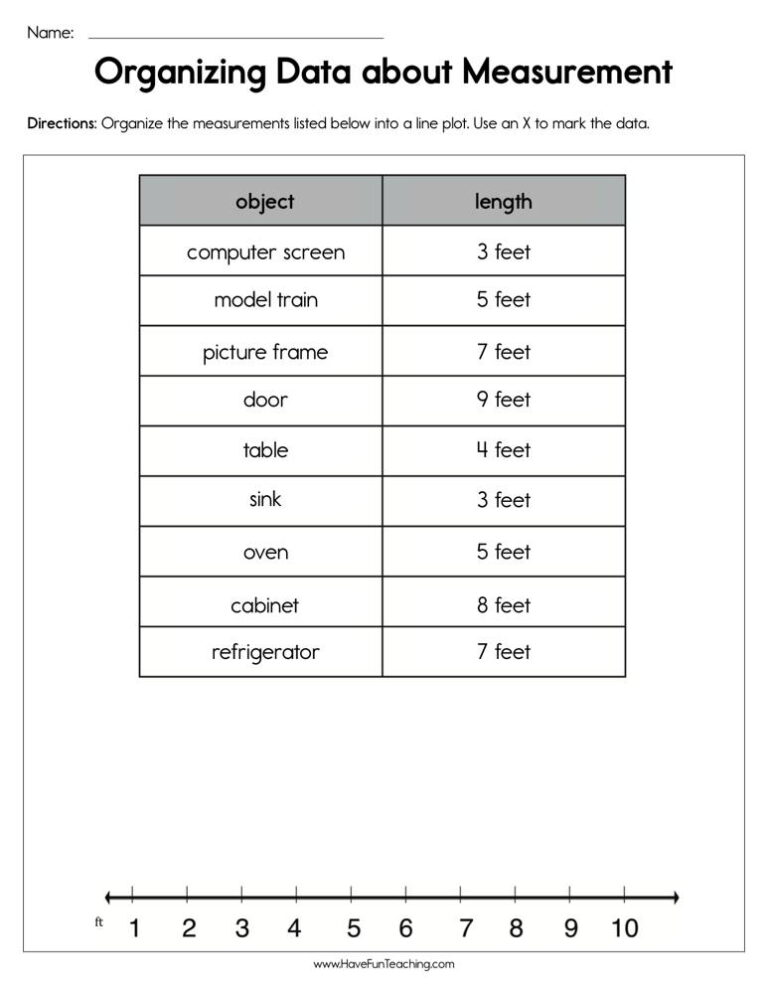
This organizing data about measurement worksheet has 4th grade students plot quarter-inch leaf lengths on a line plot and solve fraction questions. An answer key is included to make checking simple.
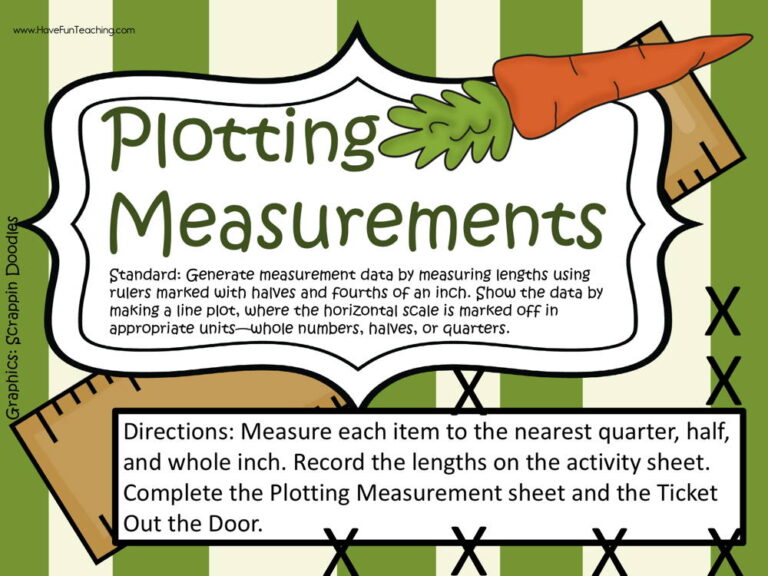
Using this Plotting Measurements Activity, students organize the measurements listed below into a line plot by using an X to mark the data.
In this 4.MD.4 Fourth Grade Common Core Lesson, students make and solve problems involving a line plot of a data set of measurements in fractions of a unit.
A NJSLA-A 4th grade math practice test workbook for teachers, with a pretest, skill practice for all 30 standards, mixed review and 2 full-length practice tests. Answer key included, so test prep is ready to go.
A printable, ready-to-use blank calendar with a landscape monthly grid and labeled day columns. Great for Kindergarten through 5th grade classrooms to map out lessons, holidays, and daily routines—just add the month and the dates.

Reviews
There are no reviews yet