

Favorite Apples Worksheet
This favorite apples worksheet has 2nd grade students count tally votes, color a bar graph, and answer questions about the data. An answer key is included for easy checking.
$6.97
Want this one free?
Tell us where to send it and it’s yours — no card, no catch.
One free resource per teacher. We’ll also send free teaching ideas each week — unsubscribe anytime.
Free teacher account · no credit card
Membership
Get every game, song, & printable
- Every game, on any device
- 6,500+ resources
- Assign online with HFT Classroom
Then $39.97/year · cancel anytime · See plans
- Instant digital download
- Printable PDF + answer key
- Made by real teachers
Teacher / Family membership
Teaching is easier with every resource
One membership for your whole year: 6,500+ worksheets, games, songs and videos for Preschool–6th, for your classroom or homeschool.
- Unlimited printables & downloads
- Every game, on any device
- Assign online with HFT Classroom
- Cancel anytime
Teacher / Family membership · 3 days free
Yearly
Monthly would be $119.64 a year
$3.33/month
Billed $39.97 once a year
You save $79.67 every year
Start My 3 Free Days$0 today · cancel anytime
Monthly
$9.97/month
Flexible, month to month
Yearly is just $3.33/mo. Switch and save $79.67
Start My 3 Free Days$0 today · cancel anytime
About this resource
Description
Reading a bar graph is one of the first data skills second graders learn, and this Favorite Apples Worksheet makes it fun. Students look at how one class voted for green, red and yellow apples, then turn those votes into a graph they can read and talk about. It is a tasty way to connect math to real life.
The favorite apples worksheet works in three short steps. First, students count the tally marks for each kind of apple. Next, they color one square on the bar graph for each vote. Last, they use their finished graph to answer four questions about the total, the most popular apple and how many more or fewer votes each kind got. Use it after an apple tasting, during a fall unit, or as a math center.
What’s Included
- A tally chart showing class votes for green, red and yellow apples
- A blank bar graph with a scale from 1 to 8
- Four questions on putting together and comparing the data
- A complete answer key with the colored graph
Why It Helps Kids
First, counting tally marks in groups of five builds quick, accurate counting. Second, coloring one square per vote shows children how a bar graph stands for real numbers. Third, the questions practice adding and comparing, the same put-together and compare problems second graders see on tests. This 2nd grade graphing worksheet ties all three skills together on one page.
Ideas for Teachers and Parents
Bring in green, red and yellow apple slices and let your own class vote, then compare your results with the worksheet. At home, take a family vote on favorite fruits and make a bar graph together. Ask children to write one more question about the graph for a partner to answer.
Related Resources
What teachers say
Reviews
Write a review, earn store credit
Get 25¢ in credit for every approved review of a resource you’ve downloaded, played or purchased — up to 15 a month. Credit applies automatically to your membership payments, so your reviews can help pay for your membership.
Honest reviews only — any star rating earns the same. Program rules
Log in to write a review and earn store credit.

These Donut Cut Outs quickly give you templates that can be easily cut and applied for classroom decoration or student activities
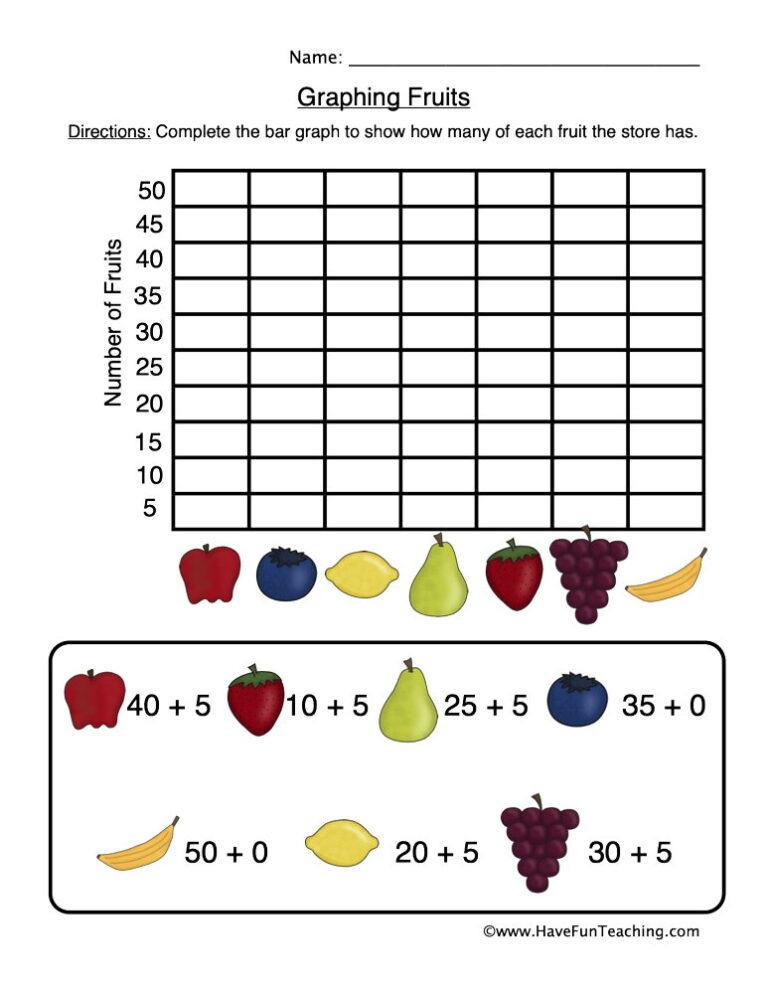
The Graphing Fruits Worksheet has 2nd grade students solve four addition facts, color a bar graph with their answers and read it to answer three questions, with a full answer key.

The Classifying Proteins, Grains, Fruits and Veggies Worksheet asks 2nd grade students to sort fifteen everyday foods into three labeled food groups. An answer key is included, so classifying practice checks itself.

Using these Fruit Flash Cards, students improve their fruit vocabulary by describing the colorful flash cards.

This dozen donuts reading comprehension worksheet gives 2nd grade students a short bakery story, four multiple-choice questions, and a written response. An answer key is included, so checking the work is quick.
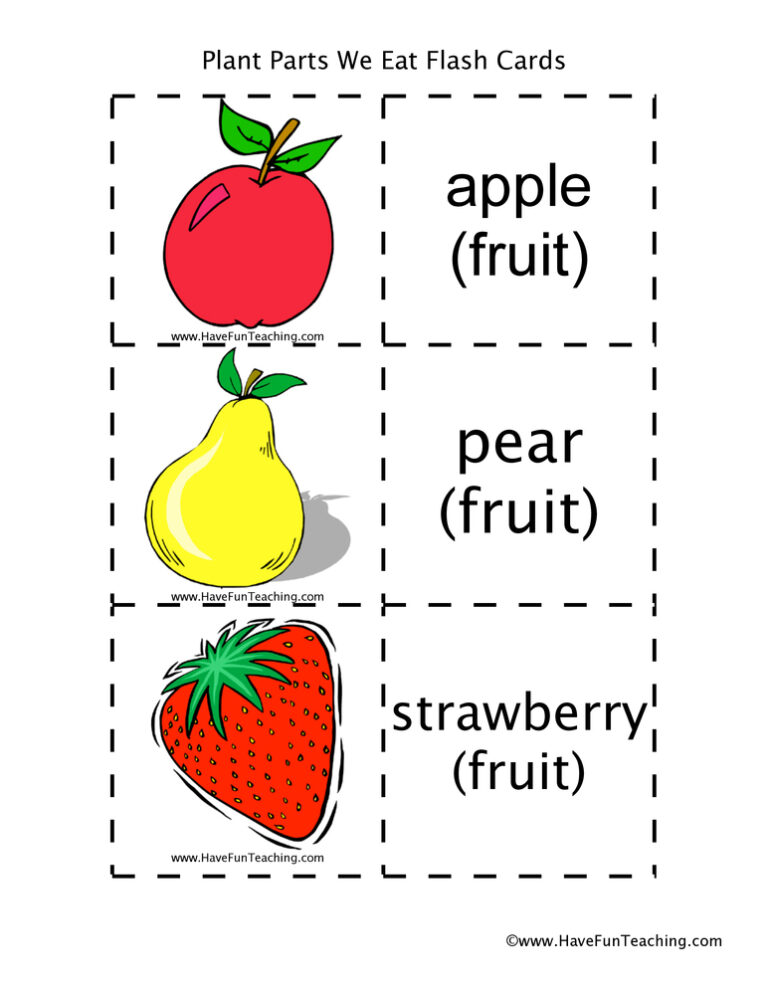
Plants we eat flash cards help Kindergarten to 3rd grade children match 18 foods to the root, stem, leaf, flower, fruit or seed we eat. Answer key included for quick, confident checking.

UsingFruits and Vegetables Activity, studentsplay the Stone Soup game to practice identifying and classifying fruits and vegetables.

Using these Dessert Flash Cards, students improve their dessert vocabulary by describing the colorful flash cards.

These apple theme flash cards teach 18 apple words with a picture on the front and the word inside. Made for Preschool to 4th Grade, with a practice page and answer key included.

Using Supermarket Sweep Food Words Activity, students practice reading high frequency words tocollect all of the food items on your shopping list.

This Spicy Chicken Reading Comprehension Worksheet gives 2nd grade readers a short science text about why hot peppers make food spicy, with five questions and an answer key for quick checking.
Using this Healthy Eating Mini Pack, students learn about Healthy Eating through ten fun worksheets and three activities.
Reviews
There are no reviews yet