
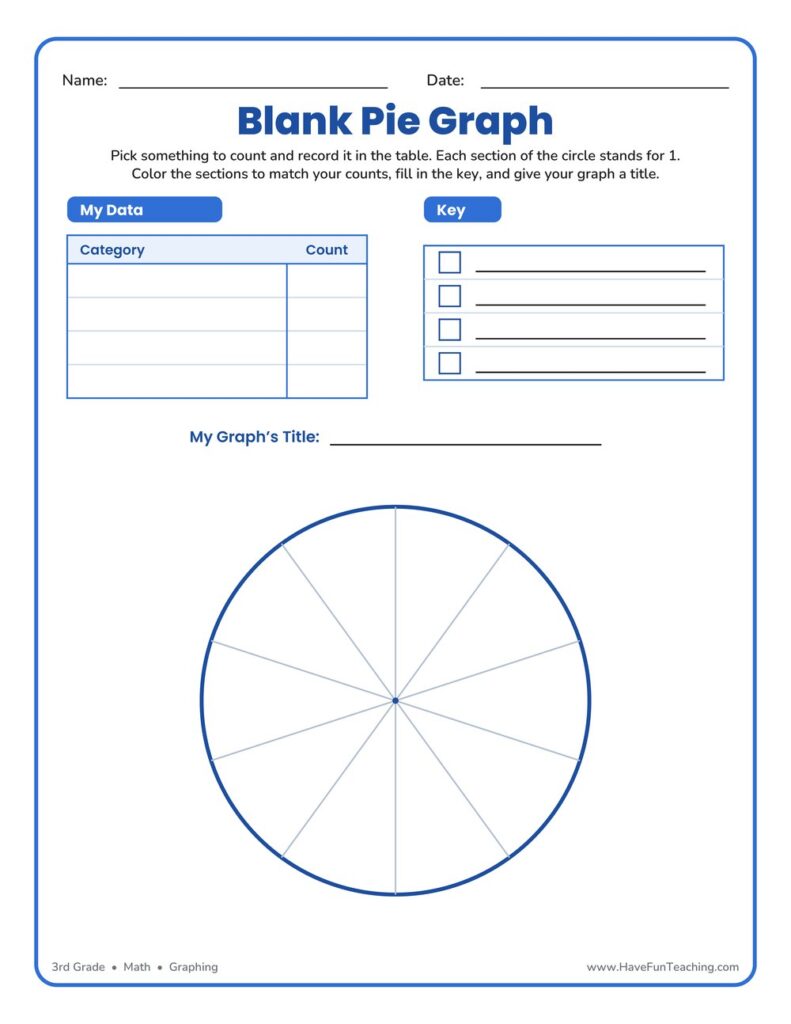
Blank Pie Graph
A blank pie graph worksheet where 3rd graders collect their own data, color the circle sections, and label a key. A reusable, no-prep template for hands-on graphing practice at home or school.
$6.97
Or free with a membership — members pay $3.33/mo for all 10,000+ resources. See plans
Want this one free?
Tell us where to send it and it’s yours — no card, no catch.
One free resource per teacher. We’ll also send free teaching ideas each week — unsubscribe anytime.
Teaching is easier with a membership
Unlimited printables, games & videos for PreK–6th — for your classroom or homeschool. Cancel anytime.
Start your 3-day free trial$0 today · cancel anytime · Instant access to 10,000+ resources
About this resource
Description
A pie graph, also called a circle graph, shows how the parts of a group compare to the whole. This blank pie graph worksheet gives 3rd grade students a ready-to-use circle divided into equal sections so they can turn their own information into a colorful pie graph. Instead of only reading a graph that someone else made, children collect data, sort it into categories, and build the graph themselves — a hands-on way to see fractions of a whole and understand how numbers can be pictured.
This printable circle graph template keeps everything on one clean page. Students pick something to count — favorite fruits, colors, pets, or classroom votes — and record each category and its count in the data table. Each section of the circle stands for one, so children simply color sections to match their counts, fill in the key with the color they chose for each category, and write a title for their finished graph.
What’s Included
- 1 print-ready PDF worksheet
- A data table, a color key, and a blank pie graph
- A reusable template that works with any set of data
This blank pie graph worksheet helps kids learn graphing in three ways. First, it builds a real understanding of part-to-whole thinking, because every colored section shows how one category fits inside the whole circle. Second, it connects counting and sorting to a clear visual, so abstract numbers become something children can see and compare at a glance. Third, it develops the habits of good data work — labeling a key, adding a title, and keeping categories organized — skills students will use with every kind of graph.
Teachers and parents can stretch this activity in many fun directions. Take a survey of the class or family and graph the results together, then compare two finished graphs to talk about which category has the most and the least. Use the template to track something over a week, such as the weather or books read, and watch the circle fill in. Tie it to a fractions lesson by asking how many sections make up half or a quarter of the circle, or laminate a copy so students can graph fresh data again and again.
Related Resources
What teachers say
Reviews
You must be logged in to post a review.
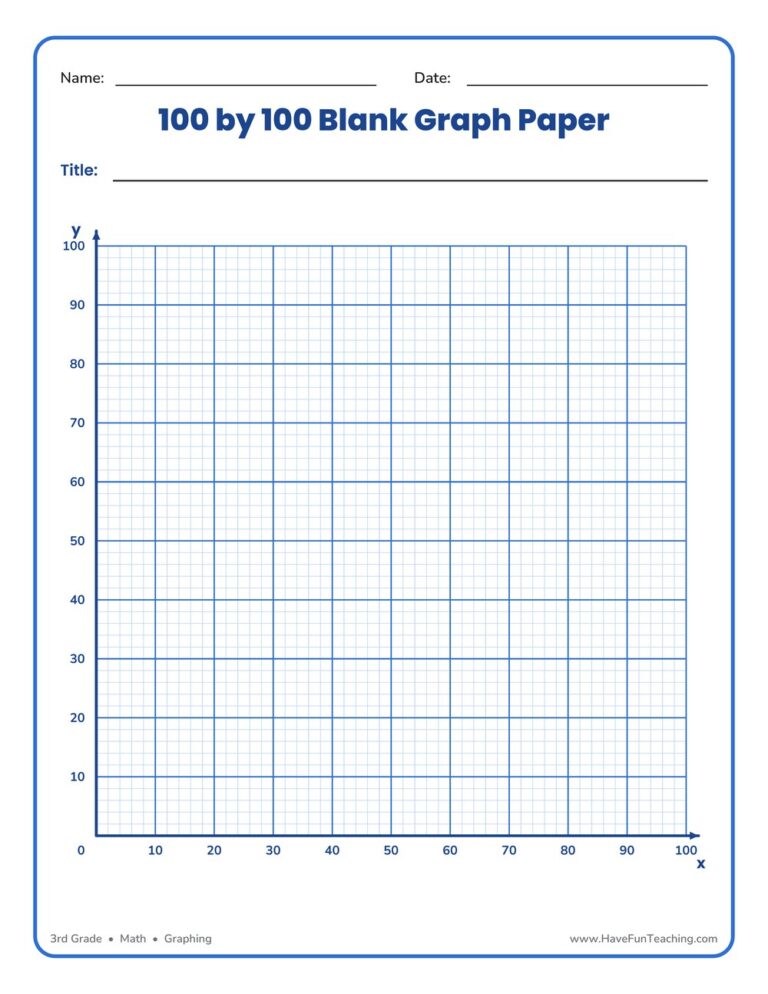
This 100 by 100 blank graph paper worksheet gives 3rd graders a ready-made coordinate grid numbered to 100 by tens — perfect for plotting points, building bar graphs, and organizing data with no prep required.
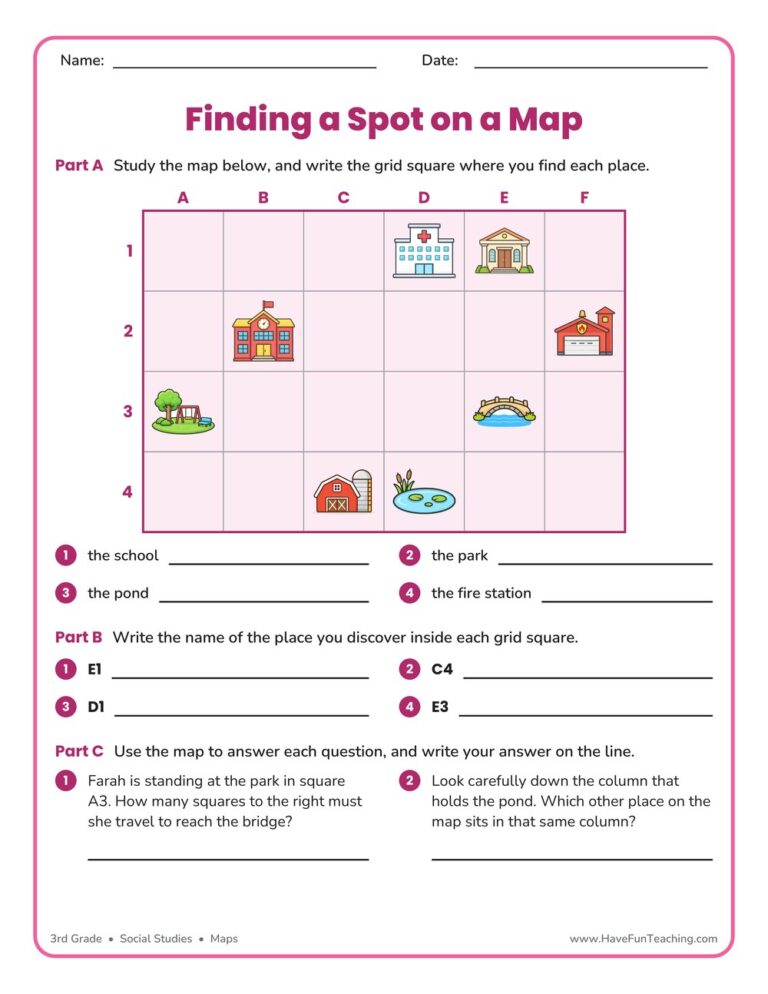
A finding a spot on a map worksheet for 3rd grade, built on one labeled town grid with place-to-square, square-to-place, and reasoning questions. Answer key included for quick no-prep map skills practice.

This making a graph using data worksheet has 3rd graders build a scaled bar graph from an orchard data table, then answer four questions about it. An answer key is included, so graphing practice needs no prep.

Students build a scaled bar graph from a class food survey in this Thanksgiving Graph Worksheet, then answer comparison questions about the data. Written for 3rd Grade, with an answer key included for fast checking.
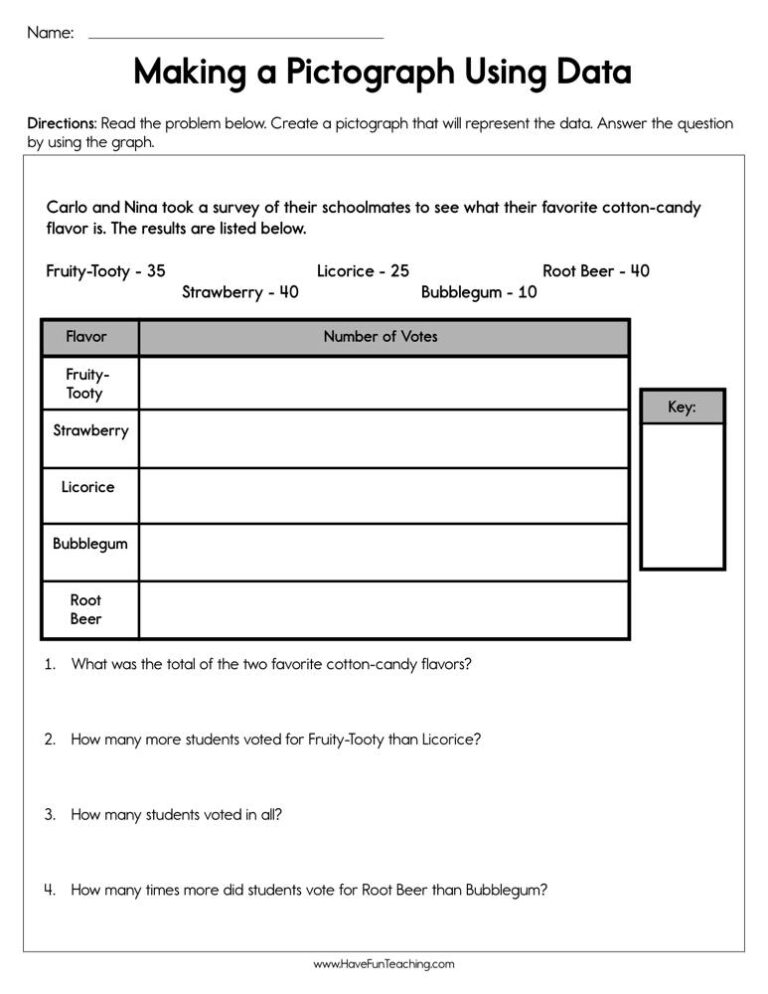
A Making a Pictograph Using Data Worksheet for 3rd Grade: students draw one star for every five votes, then read, compare, and explain their graph. Answer key included for easy, no-prep graphing practice.

This Multiplication Bar Graphs Worksheet has 3rd grade students solve six multiplication problems and graph each product on a scaled bar graph. An answer key is included, so checking work takes seconds.

This organizing data using a bar graph worksheet has 3rd Grade students turn a data table into a scaled bar graph, then answer read, compare and two-step questions. An answer key is included.

Using this Graphing Measurements Worksheet, students measure the objects below to create a line graph that shows growth over time.
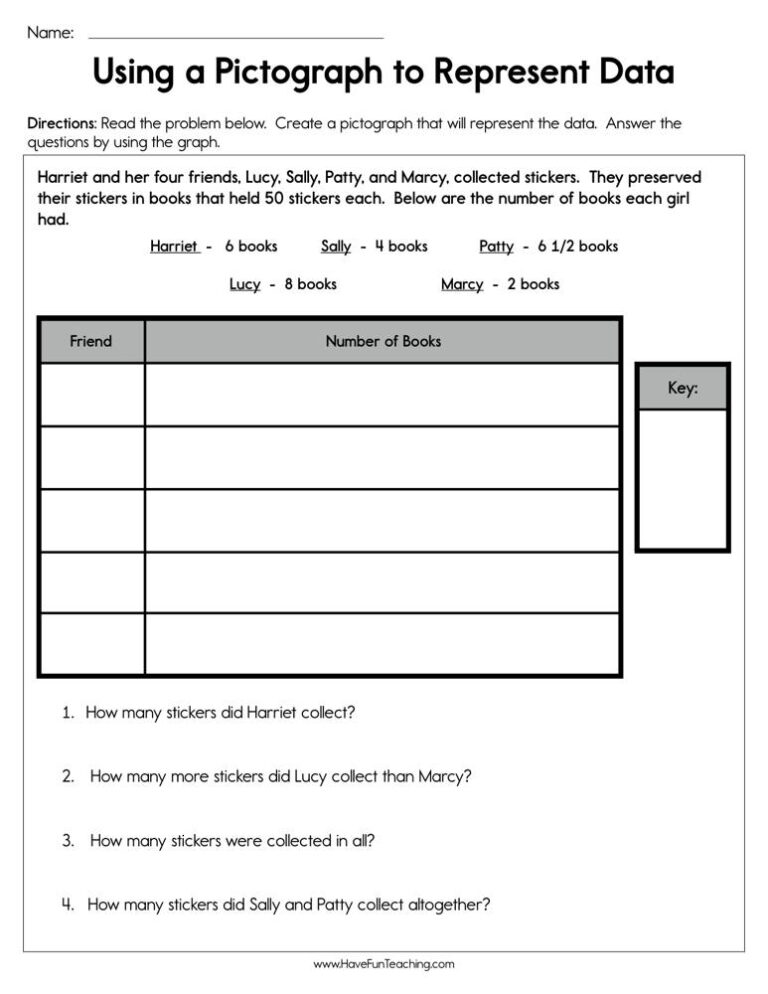
This using a pictograph to represent data worksheet has 3rd Grade students draw a scaled star graph, with half stars, from a sticker table. Answer key included for easy checking.

This graphing favorite foods worksheet has 3rd graders draw a scaled bar graph from lunch vote data, then answer comparison and two-step questions. An answer key is included for fast checking.
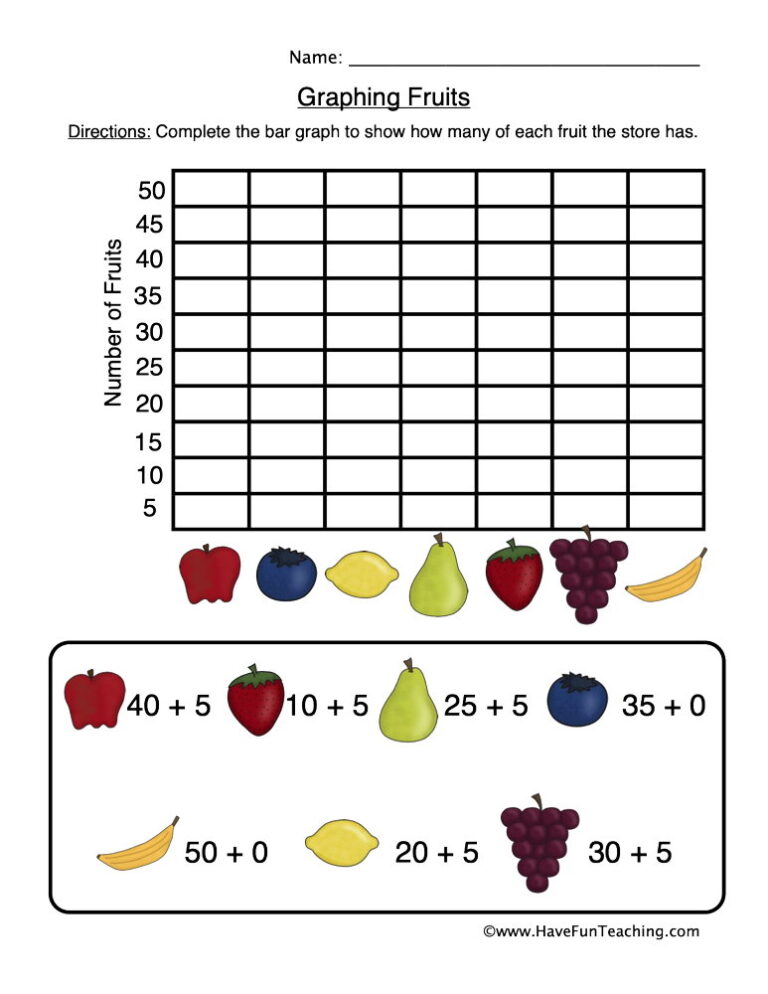
The Graphing Fruits Worksheet has 2nd grade students solve four addition facts, color a bar graph with their answers and read it to answer three questions, with a full answer key.
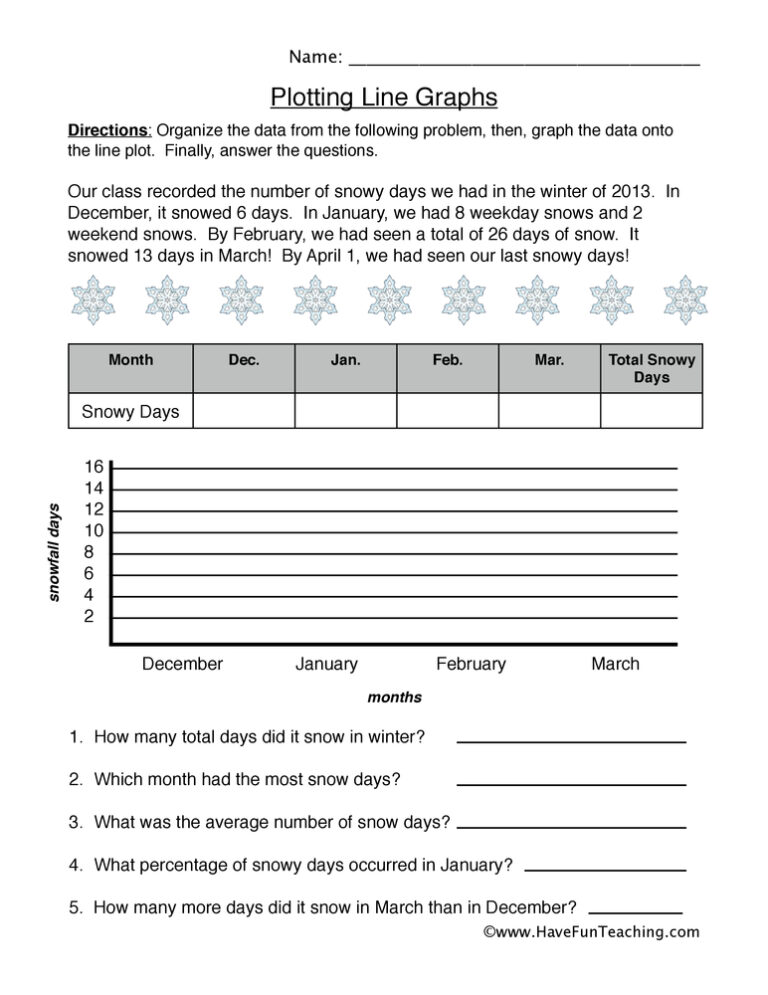
Using this Plotting Line Graph Worksheet, students analyze the number of snowy days in a line graph.




Reviews
There are no reviews yet