Skip to content
Start My 3 Free Days $0 today · cancel anytime

Graphing Worksheets

65 graphing worksheets. Teacher favorites: 100 by 100 Blank Graph Paper and 20 by 20 Blank Graph Paper. How teachers use these

Graphing Worksheets

65 graphing worksheets. Teacher favorites: 100 by 100 Blank Graph Paper and 20 by 20 Blank Graph Paper. How teachers use these

Worksheet
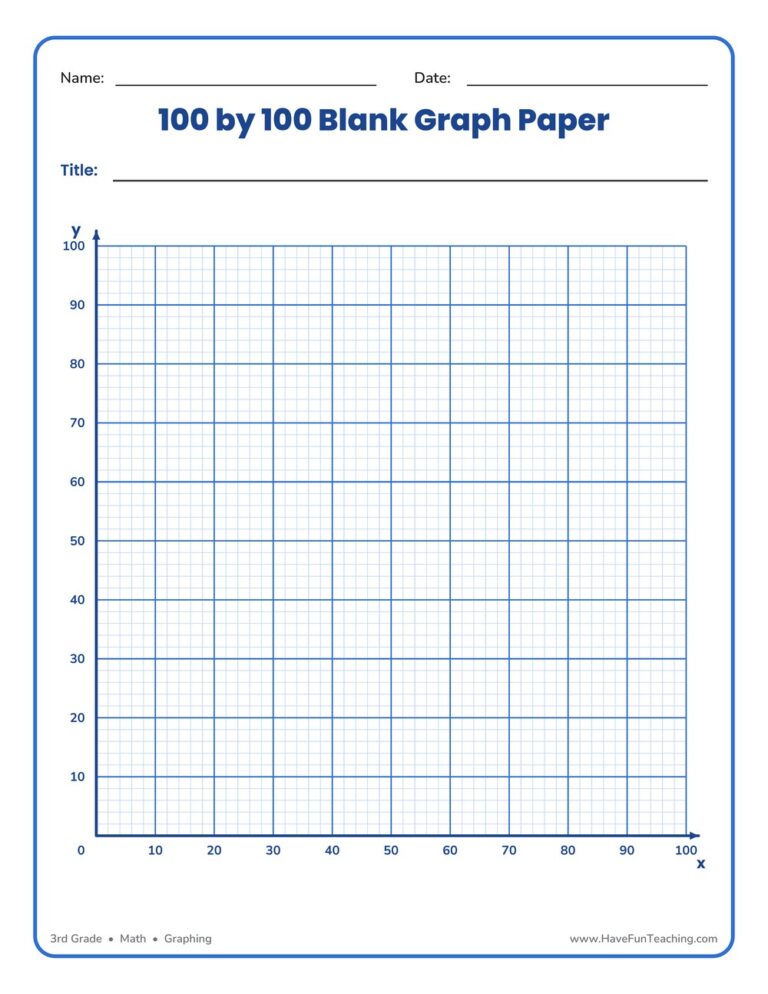
Worksheet3rd Grade100 by 100 Blank Graph Paper

This 100 by 100 blank graph paper worksheet gives 3rd graders a ready-made coordinate grid numbered to 100 by tens — perfect for plotting points, building bar graphs, and organizing data with no prep required.

Worksheet
Worksheet2nd Grade20 by 20 Blank Graph Paper

This printable 20 by 20 Blank Graph Paper Worksheet gives 2nd graders a clean 20 by 20 grid for bar graphs, plotting points, and organizing data. A versatile, no-prep template for any math lesson.

Worksheet
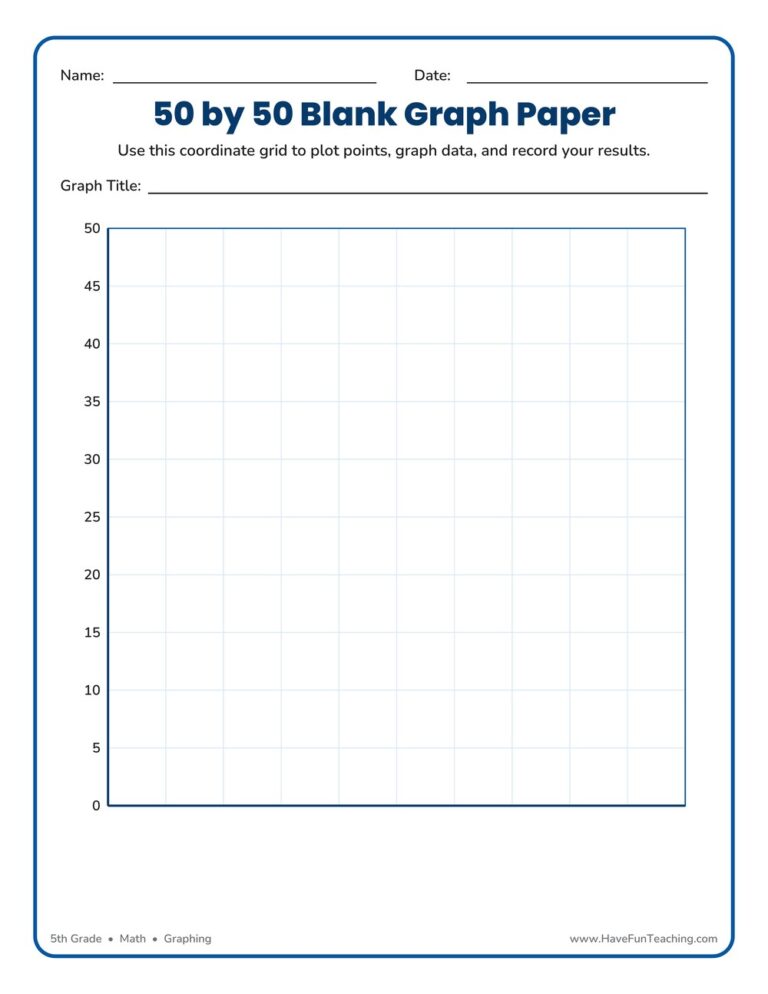
Worksheet5th Grade50 by 50 Blank Graph Paper

This 50 by 50 blank graph paper gives 5th grade math students a clean, pre-numbered coordinate grid (0 to 50 by fives) for plotting points and graphing data. Two ready-to-print grid pages make neat, accurate graphs simple at home or school.

Worksheet
Worksheet5th Grade30 by 30 Blank Graph Paper

This 30 by 30 blank graph paper gives 5th graders a large, reusable grid for graphing and plotting points. Print it for coordinate plotting, bar graphs, geometry, and everyday math practice.

Worksheet
Worksheet5th GradeFind Coordinate Pairs Worksheet

A garden-themed Find Coordinate Pairs Worksheet where 5th graders write ordered pairs for plotted points, then plot and connect four corners to find a perimeter. Answer key included for fast, no-prep graphing practice.

Worksheet
Worksheet1st GradeValentine's Day Graphing Worksheet

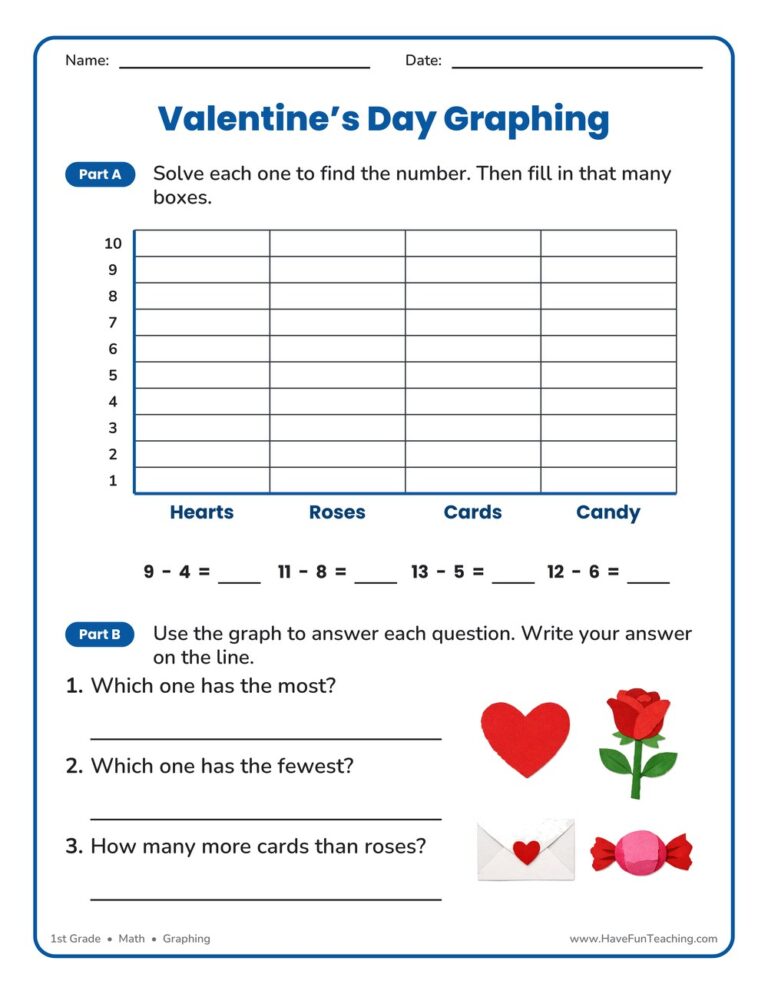
This Valentine's Day Graphing Worksheet has 1st Grade students solve four subtraction facts, fill in a bar for each answer, and read the graph they built. Answer key included, so checking takes seconds.

Worksheet
Worksheet2nd Grade10 by 10 Blank Graph Paper

Give 2nd Grade graphers an open grid: this 10 by 10 blank graph paper worksheet has 100 equal squares plus lines for the graph title and both labels. Ready for any survey, tally, or weather log.

Worksheet
Worksheet3rd GradeFinding a Spot on a Map Worksheet

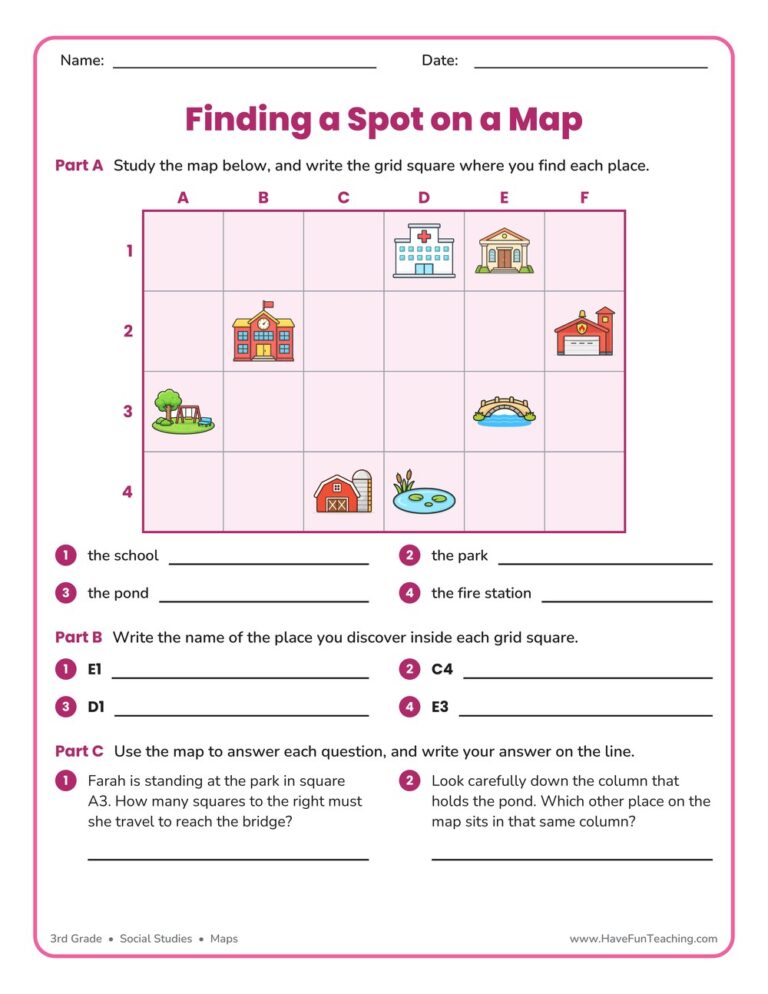
A finding a spot on a map worksheet for 3rd grade, built on one labeled town grid with place-to-square, square-to-place, and reasoning questions. Answer key included for quick no-prep map skills practice.

Worksheet
Worksheet5th GradeBlank Coordinate Grid

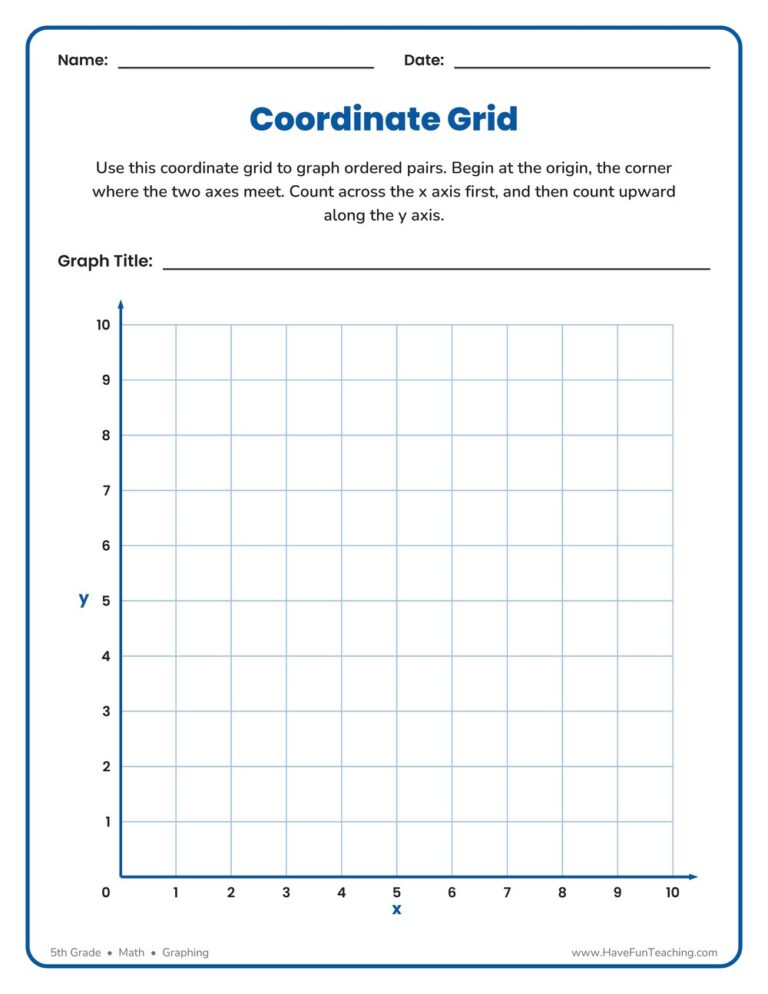
Use this blank coordinate grid to help 5th Grade students plot ordered pairs on a first-quadrant coordinate plane. A reusable graphing template for lessons, warm-ups, and math centers.

Worksheet
Worksheet5th GradePlotting Graphing Coordinates Worksheet

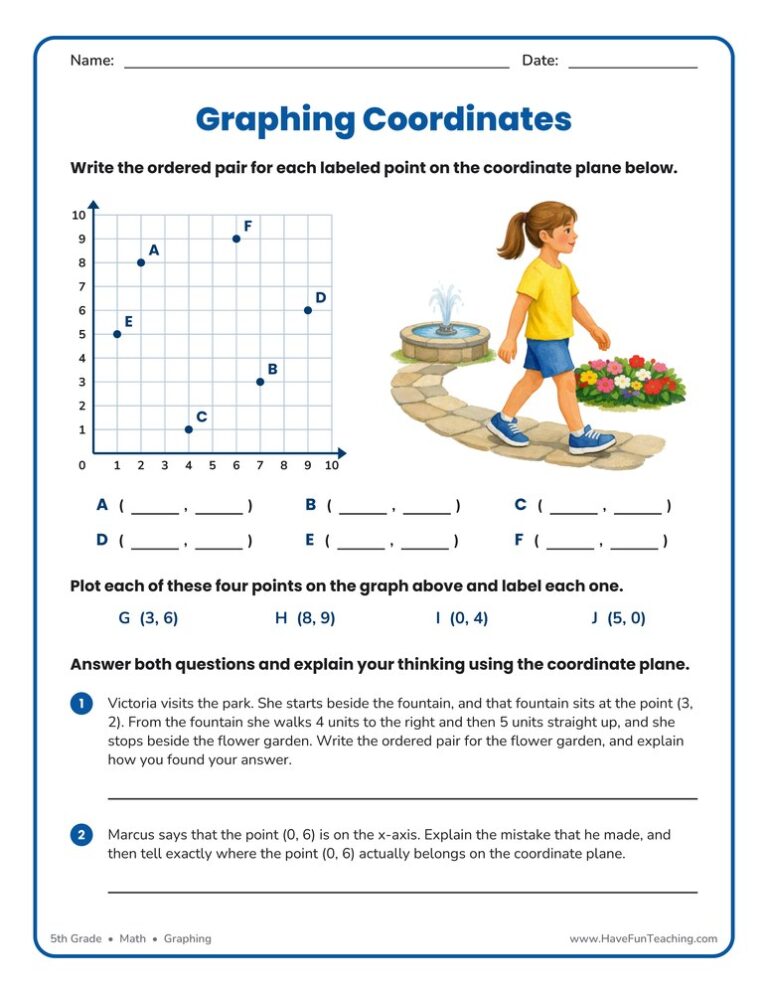
This Plotting Graphing Coordinates Worksheet gives 5th Grade students practice naming and plotting points on a coordinate plane. An answer key is included, so children can check their own work and build confidence fast.

Worksheet
Worksheet5th Grade1000 by 1000 Blank Graph Paper

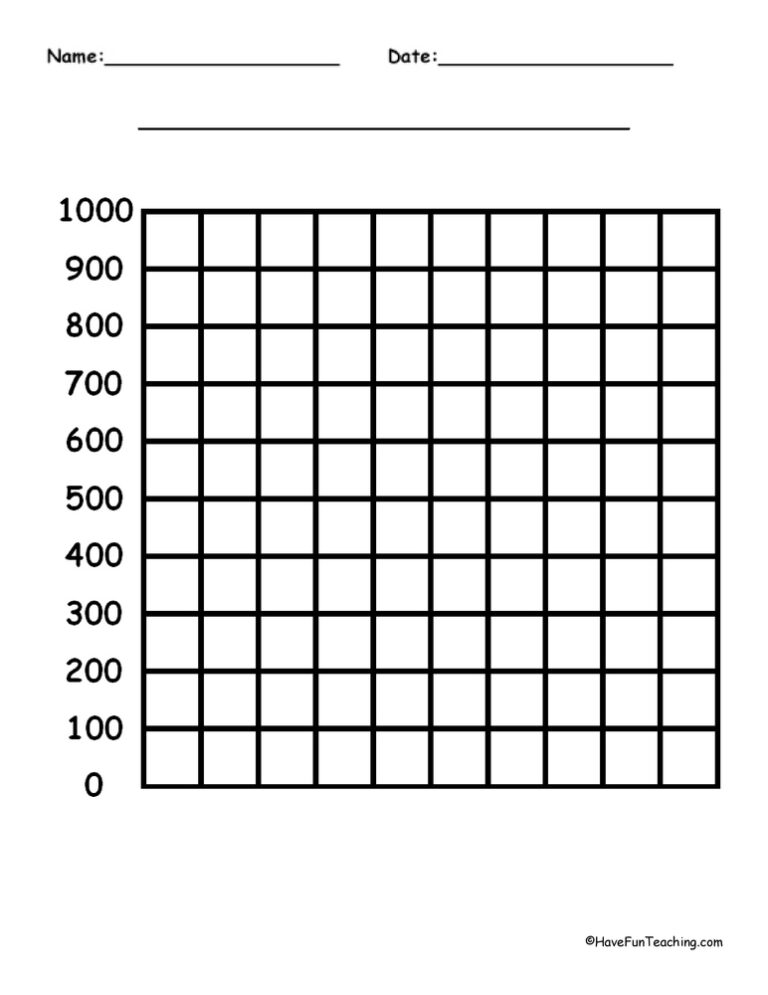
This 1000 by 1000 blank graph paper gives 5th grade students a first-quadrant grid with both axes numbered to 1000, plus title and label lines, so any data set is easy to plot.

Worksheet
Worksheet1st GradeNumber Lines Template

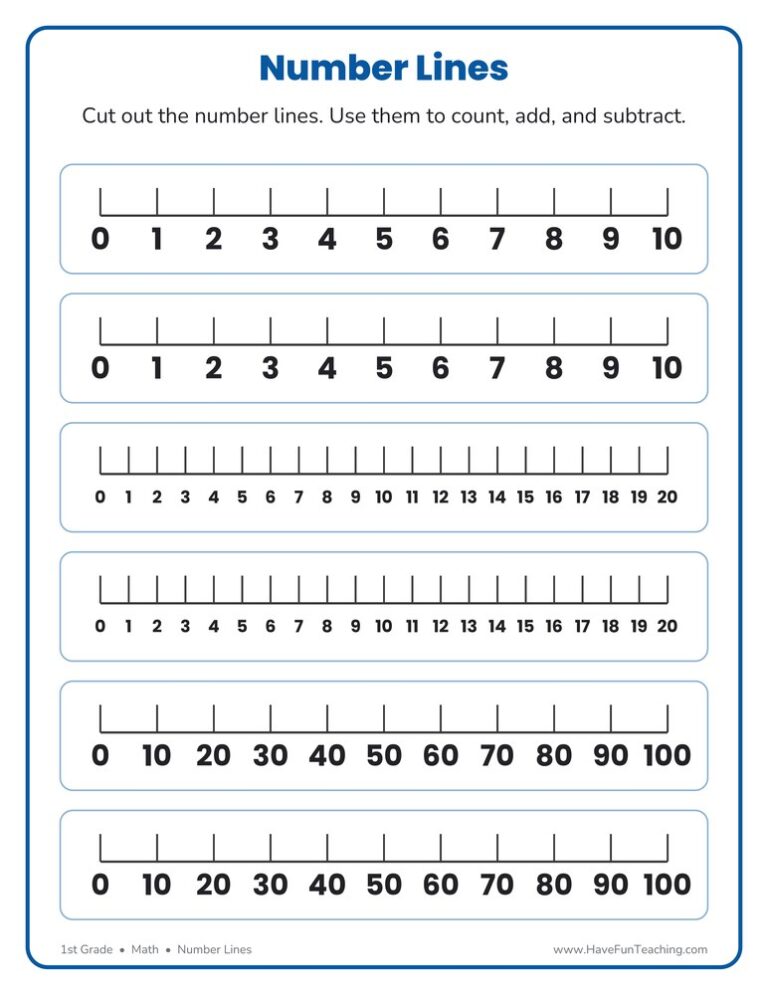
This number lines template worksheet prints six cut-out number lines for 1st grade: two to 10, two to 20, and two counting by tens to 100. Hand one to every student for counting, adding, and subtracting.

Worksheet
Worksheet5th Grade500 by 500 Blank Graph Paper

This 500 by 500 blank graph paper worksheet gives 5th grade students a first quadrant grid numbered by fifties, with title and axis label rules, so they can plot and graph their own data with confidence.

Worksheet
Worksheet1st GradeMaking a Graph Using Data Worksheet

This making a graph using data worksheet has 3rd graders build a scaled bar graph from an orchard data table, then answer four questions about it. An answer key is included, so graphing practice needs no prep.

Worksheet
Worksheet3rd GradeBlank Pie Graph

A blank pie graph worksheet where 3rd graders collect their own data, color the circle sections, and label a key. A reusable, no-prep template for hands-on graphing practice at home or school.

Worksheet
Worksheet2nd GradeGraphing Sports Worksheet

This graphing sports worksheet has 2nd Grade students count sports balls, color a bar graph from their own data, and answer three questions about it. An answer key is included.

Worksheet
Worksheet3rd GradeOrganizing Data Using a Bar Graph Worksheet

This organizing data using a bar graph worksheet has 3rd Grade students turn a data table into a scaled bar graph, then answer read, compare and two-step questions. An answer key is included.

Worksheet
Worksheet3rd GradeThanksgiving Graph Worksheet

Students build a scaled bar graph from a class food survey in this Thanksgiving Graph Worksheet, then answer comparison questions about the data. Written for 3rd Grade, with an answer key included for fast checking.

Worksheet
Worksheet2nd GradeAnimals Bar Graph Worksheet

An animals bar graph worksheet for 2nd grade: students color one box per animal to build a four-category bar graph, then compare and add using it. Answer key included, so checking data work takes seconds.

Worksheet
Worksheet3rd GradeMultiplication Bar Graphs Worksheet

This Multiplication Bar Graphs Worksheet has 3rd grade students solve six multiplication problems and graph each product on a scaled bar graph. An answer key is included, so checking work takes seconds.

From our teachers' playbook

Turn data into pictures

What do kids learn about graphing?

Graphing turns numbers into a picture you can read in a snap. Kindergartners sort and count objects, and 1st graders organize data into up to three groups. In 2nd grade, kids make picture graphs and bar graphs and answer questions like "how many more?" Third graders use scaled graphs where each picture stands for more than one, plus line plots. In 5th grade they graph points on a coordinate plane: (3, 5) = over 3, up 5. The click comes when kids realize a graph tells a story about the data.

Our favorite ways to teach graphing

Graphing is most fun when kids collect their own data. These are the moves we use.

Make a human bar graph

Ask a question like "What's your favorite fruit?" and have kids line up behind a sign for their answer. Count each line, then turn it into a bar graph on paper. Kids see that the bars are just the lines they stood in.

Why it works: going from real objects to pictures to symbols is a core recommendation of the U.S. Department of Education's elementary math guide.

Making a Graph Using Data WorksheetTry it withMaking a Graph Using Data WorksheetWorksheetsOpen it →

Walk before you climb

For coordinates, model out loud: "Start at zero, walk along the hall first, then climb the stairs." Plot a few points together, then kids plot their own. The walk-then-climb phrase stops the classic mix-up of switching x and y.

Why it works: handing over the work step by step, from teacher to student, is one of the most widely used teaching frameworks (Pearson and Gallagher, 1983).

Plotting Graphing Coordinates WorksheetTry it withPlotting Graphing Coordinates WorksheetWorksheetsOpen it →

Graph it, then compute it

Give kids bar graphs that require multiplication or comparison to answer. How many more? How many in all? Mixing graph reading with other math keeps skills sharp and mirrors real test questions.

Why it works: shuffled practice teaches kids to choose the right strategy, not just repeat one, and it improved test scores in research (Rohrer and Taylor, 2007).

Multiplication Bar Graphs WorksheetTry it withMultiplication Bar Graphs WorksheetWorksheetsOpen it →

Graphing questions we hear a lot

What types of graphs do kids learn in elementary school?

Kids learn picture graphs, bar graphs, tally charts and line plots, and later line graphs, pie graphs and the coordinate plane. Most start with picture graphs in 1st or 2nd grade.

What's the difference between a bar graph and a line graph?

A bar graph compares amounts in different groups, like favorite colors. A line graph shows how something changes over time, like temperature during a week.

How do I teach plotting points on a graph?

Teach kids to go across the x-axis first and then up the y-axis. Practice with a big grid on the floor so kids can walk the points with their feet before plotting on paper.

Can I print blank graph paper here?

Yes! You'll find printable blank graph paper in several grid sizes, plus blank coordinate grids and pie graph templates.