
3 days free
Ready for the whole library?
You’ve had your freebie — but members download 10,000+ resources for every grade, all year long. Try it free — $0 today, cancel anytime.
Free for teachers
Pick your grade. We’ll send 10 free resources.
Worksheets, activities and a video — picked for your classroom, ready to print tonight.
One free bundle per teacher. We’ll also send free teaching ideas each week — unsubscribe anytime.



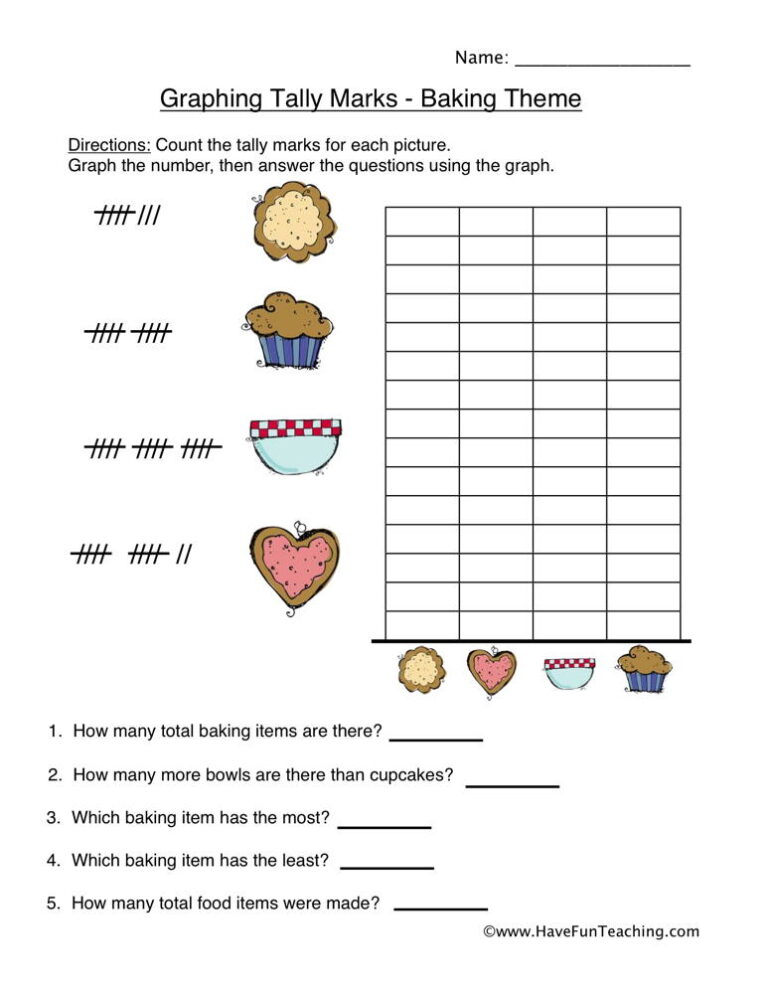
This baking graphing tally marks worksheet has 2nd graders count four sets of tally marks and color a bar graph, then answer four questions. An answer key is included, so checking takes a minute.
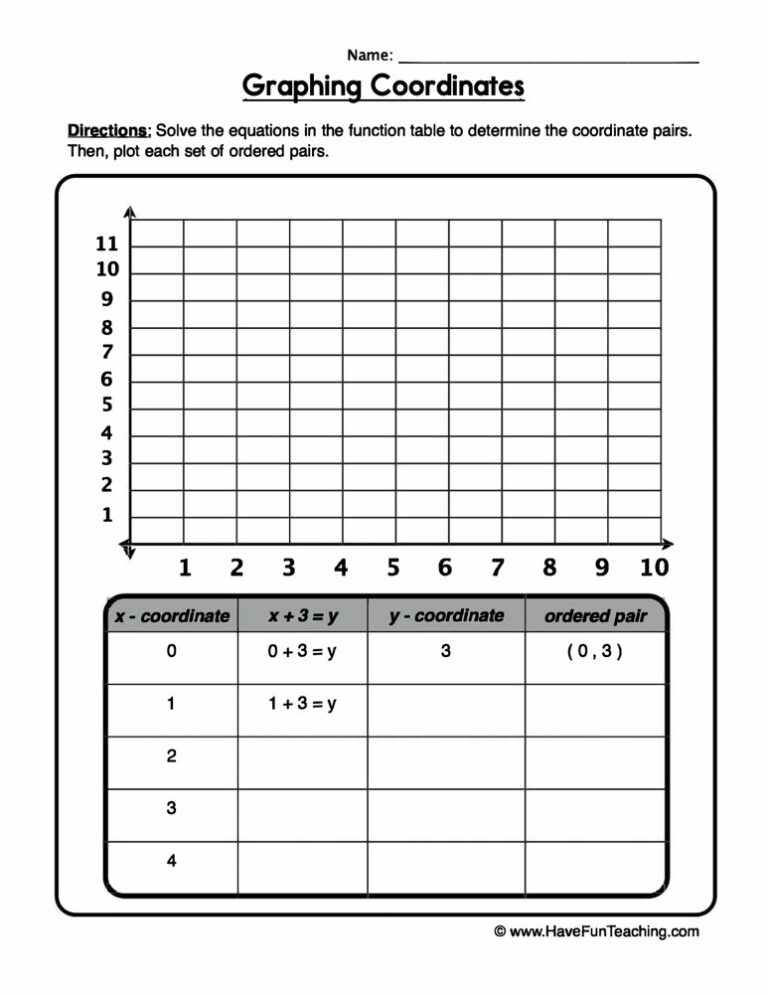
This Graphing Coordinates Equations Worksheet has 5th graders solve a function table, plot the ordered pairs on a grid, and explain the pattern. Answer key included for fast, no-prep coordinate practice.
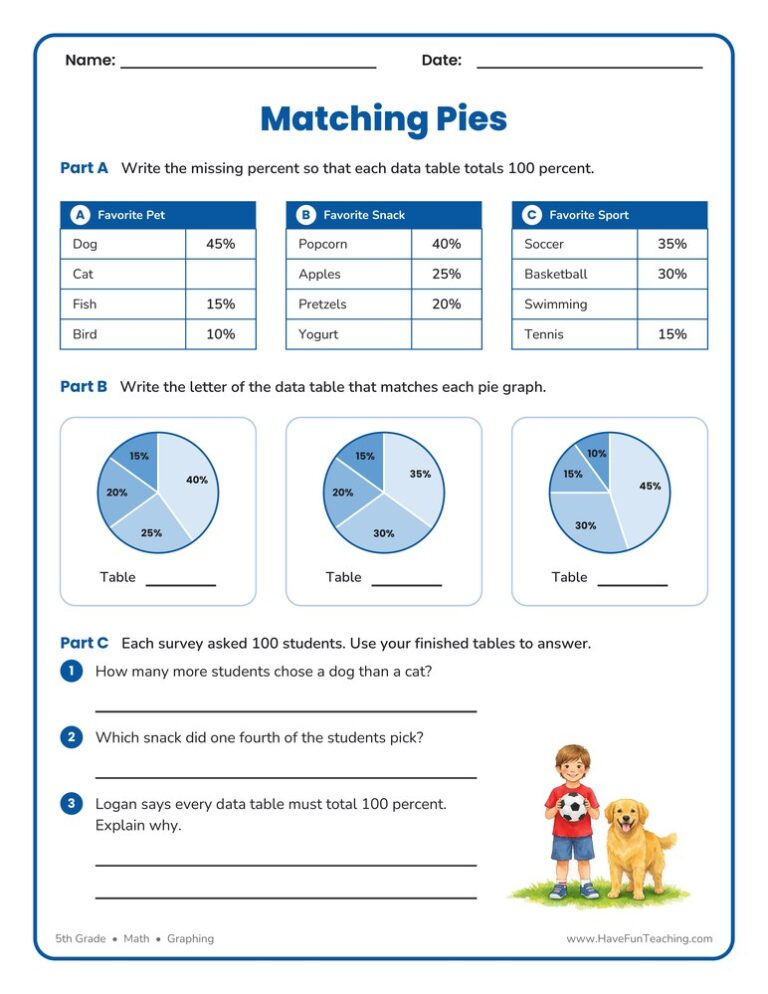
This Matching Pie Graphs Worksheet has 5th Grade students complete three data tables, match each table to its pie graph, and answer three questions. An answer key is included, so practice with circle graphs is easy to check.

This back to school graph worksheet has 2nd graders count a box of school supplies, color a bar graph from their own data, and answer three questions about it. Answer key included for fast, no-prep checking.

This organizing data using a bar graph worksheet has 3rd Grade students turn a data table into a scaled bar graph, then answer read, compare and two-step questions. An answer key is included.

This rocks and minerals graphing worksheet has 4th grade students total rock samples, draw a scaled bar graph, and solve word problems. An answer key is included for quick, easy checking.

This average state temperatures graphing worksheet has 4th graders read a scaled bar graph of monthly temperatures, then find the average of four of them. Answer key included, so data practice takes no prep.

This graphing sports worksheet has 2nd Grade students count sports balls, color a bar graph from their own data, and answer three questions about it. An answer key is included.
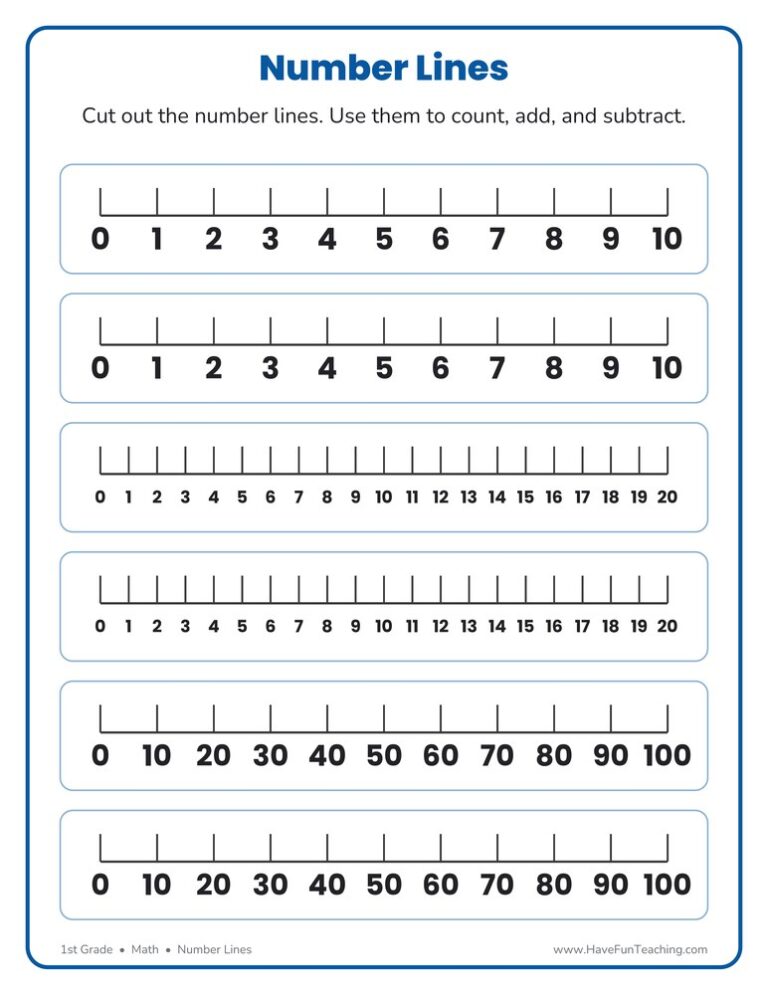
This number lines template worksheet prints six cut-out number lines for 1st grade: two to 10, two to 20, and two counting by tens to 100. Hand one to every student for counting, adding, and subtracting.

Using this Graphing Measurements Worksheet, students measure the objects below to create a line graph that shows growth over time.
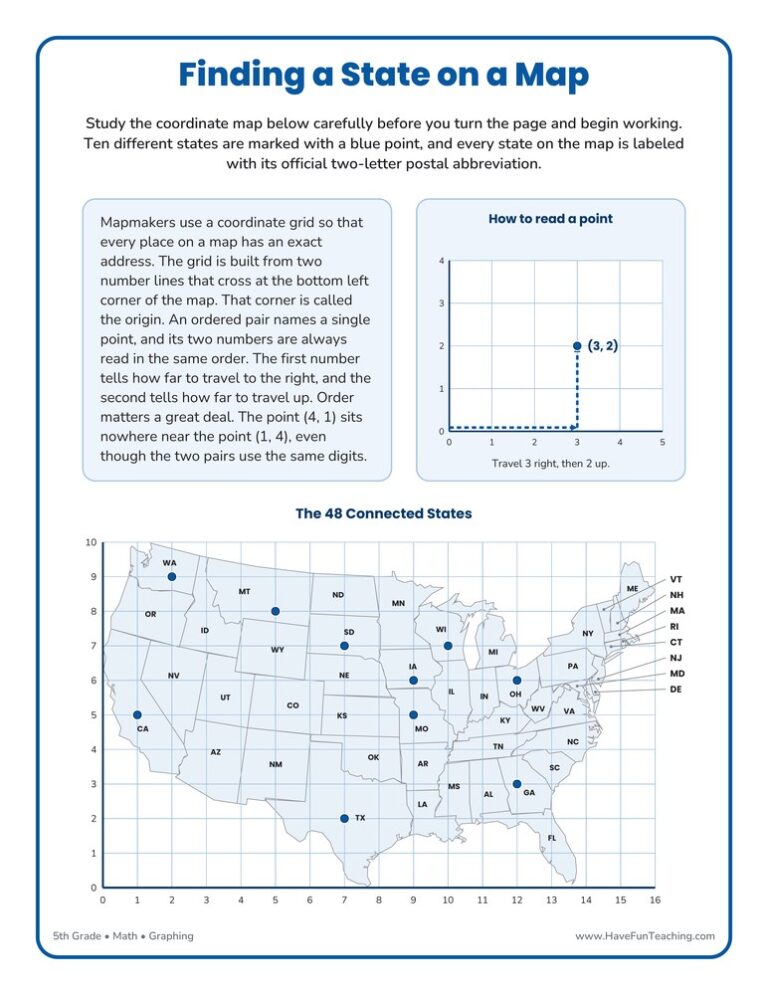
This Finding a State on a Map Worksheet gives 5th grade students a coordinate grid drawn over a United States map, plus a full answer key, so ordered pairs finally point at real places.
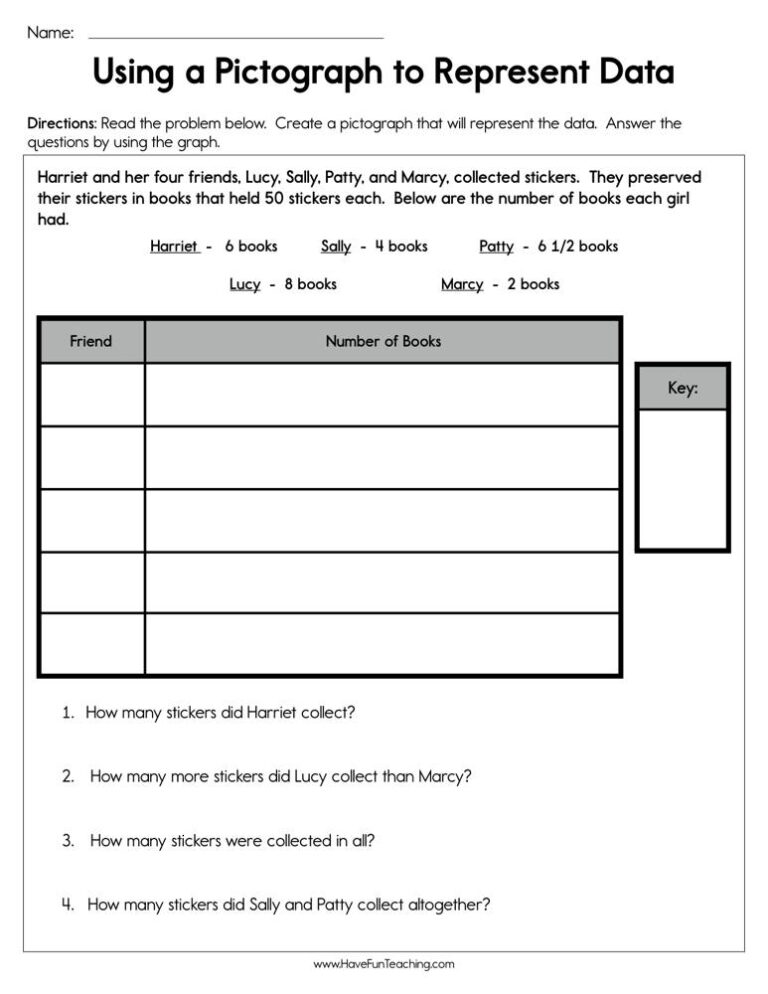
This using a pictograph to represent data worksheet has 3rd Grade students draw a scaled star graph, with half stars, from a sticker table. Answer key included for easy checking.

This Decimals Bar Graphs Worksheet asks 5th Grade students to add and subtract decimals to hundredths, then shade a bar to each answer on a 0.00 to 1.00 scale. An answer key is included.

This Pie Graphing Pies Worksheet asks 5th graders to read a bakery circle graph, find the percent for each cookie, and shade their own graph. An answer key is included, so checking the work takes seconds.

A Valentine's Day Candy Heart Graph Worksheet where 2nd graders count tally marks, color a bar graph of four candy colors, and answer four questions about their data. Answer key included for fast, no-prep graphing practice.
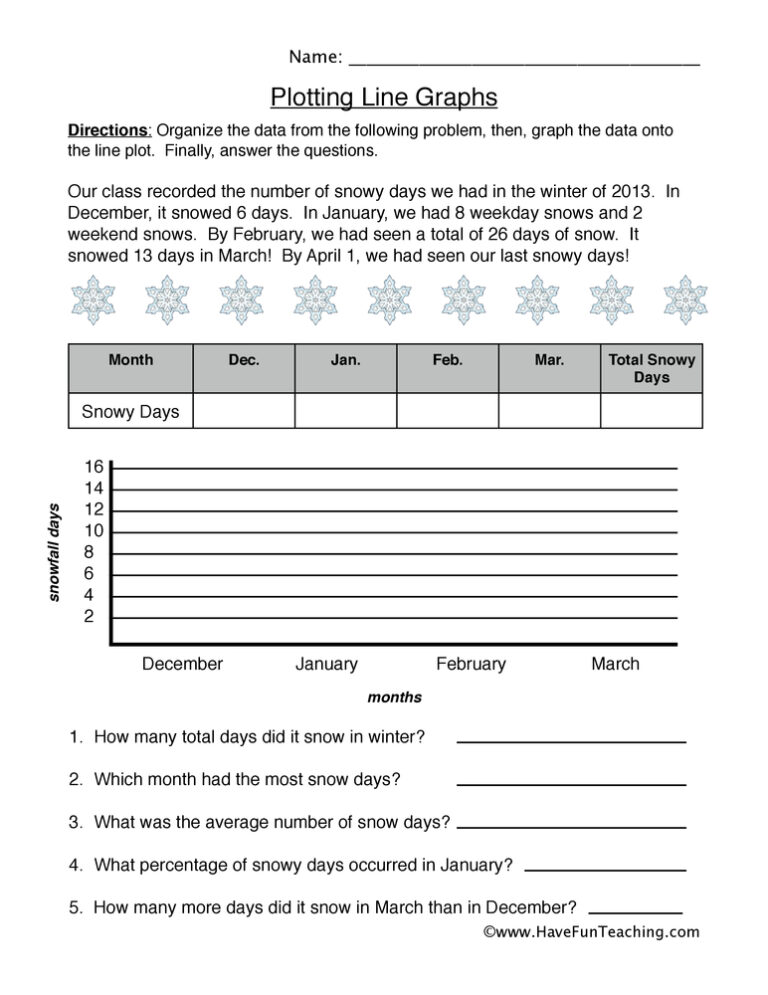
Using this Plotting Line Graph Worksheet, students analyze the number of snowy days in a line graph.

This graphing favorite foods worksheet has 3rd graders draw a scaled bar graph from lunch vote data, then answer comparison and two-step questions. An answer key is included for fast checking.
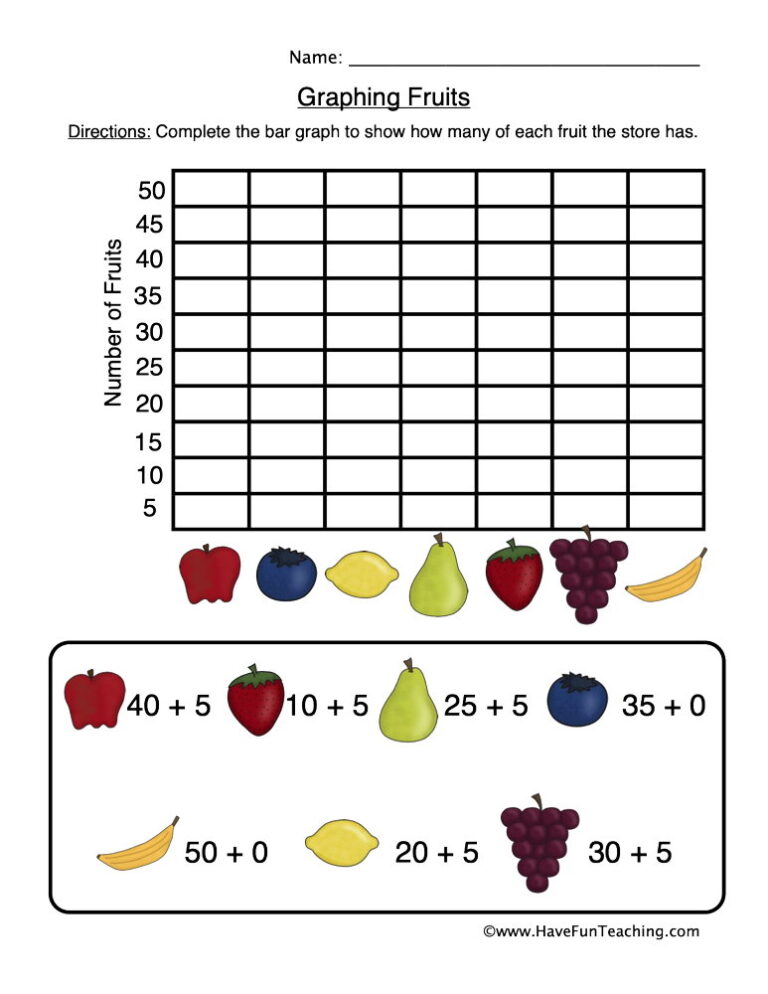
The Graphing Fruits Worksheet has 2nd grade students solve four addition facts, color a bar graph with their answers and read it to answer three questions, with a full answer key.

The Memorial Day Graphing Worksheet has 3rd Grade students skip count by twos, color a scaled bar graph, and answer four questions about it, with a full answer key so checking the work takes a minute.
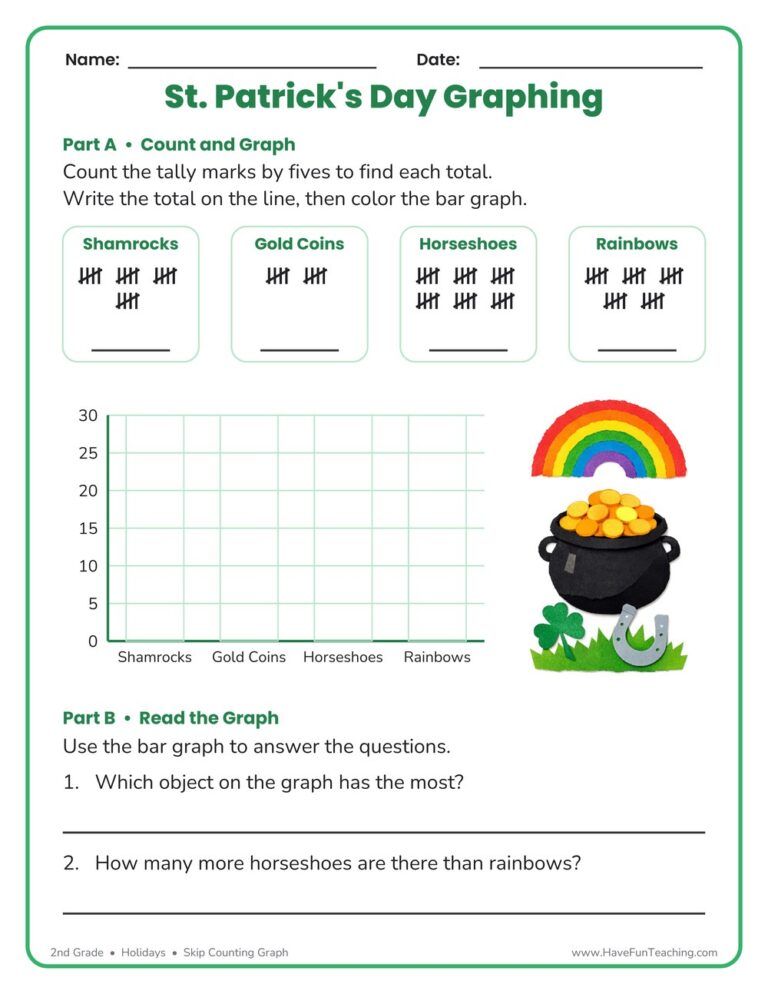
This St. Patrick's Day Skip Counting Graph Worksheet has 2nd Grade students count tally marks by fives, write each total, and color the bar graph. Answer key included, so checking takes seconds.



